
On 2026-09-23, our WebSocket game service took a median of 3.7 seconds to confirm a player's answer. 22 of 41 answers got no reply at all within the client's 10-second limit.
The same build answered in 7 ms on my laptop. It had passed three certification runs and a 60-minute soak, every one of them beside a local database. Which is an awkward thing to admit about a service whose whole job is being fast.
So after rewriting the room loop, we had two questions. How long does a player wait for an answer to be confirmed when the database is 60-odd milliseconds away? And where does the rest of that time go?
We re-measured on 2026-09-27: 5 games and 140 answers, with the service on a VPS in Phoenix and its Postgres in Virginia. Then we tested our own guess about the remainder with an A/B on 2026-09-28: 10 games, 300 answers.
Short answer: the median answer went from 3,658 ms to 328 ms, with no timeouts in 136 commands. And about 17% of what was left was a single round trip: a ping the connection pool sends before every checkout. Turning it off cut the median by 53.6 ms, against a measured round trip of 53.2 ms.
The before-and-after is not a controlled experiment, and I'll show you exactly why. The A/B is.
It follows Two real-time services on one small VPS and We threw away 38 healthy minutes of a two-hour soak test: the same service, now measured against a remote database.
Why distance hurts a room with one clerk
Hearso is standup trivia. A host opens a room, teammates join with a code, and ten questions run on a server clock. Our WebSocket service, hearso-rt, is written in Rust. The database is Supabase Postgres in us-east-1, in Virginia.
Think of each room as a counter with one clerk. Players hand in requests, the clerk handles them one at a time, and everyone else waits in line.
Precisely, each room has a room actor: a task that owns the room's state and takes commands from a queue, its mailbox, one at a time. If three players answer in the same instant, the second answer waits for the first to finish.
So every database round trip a command makes is time the next command in that room spends waiting. Distance to the database matters more here than anywhere else in our stack.
Polling made a 38 ms database feel like 3.7 seconds
The build of 2026-09-23, b5e4a3be, polled. Its room actor woke every 250 ms and reloaded the room: three sequential queries per load, and up to three loads per tick. By PR #10's count, at 38 ms a round trip, that is about 342 ms of database time in every 250 ms period. The loop could never keep up, and commands queued behind it. One game took 2,511 database transactions.
Beside a local database, the same design costs almost nothing. That is why nobody saw it.
room.answer, same binary, bots and commands | Local Postgres | DEV, through its pooler, 38 ms away |
|---|---|---|
| p50 | 7 ms | 3,658 ms (one run 10,255 ms) |
| Slowest | 21 ms | 20,572 ms |
| No reply within 10 s | 0 | 22 of 41 |
Our mistake was the test setup, not one line of code. Every certification ran with the database next to the service, so the one variable that mattered never moved. /health stayed green throughout. (A health check does not play trivia.)
Two fixes, and a prediction we could not check
Two changes followed.
| Change | What it did | Measured effect |
|---|---|---|
| PR #10, merged 2026-09-23 | The tick reads the room once, caches the question deck, and publishes the state it already has | Same rig: room.answer median 1,157-1,277 ms across runs, slowest 2,805 ms, nothing unanswered |
PR #11 (ad2624f), merged 2026-09-24 | No more polling. The actor holds the room's state and wakes only for a command, a deadline, or a signal that the web app changed the room. The room and its players load in one query | Local A/B on one database: round trips per command 6 to 2; statements for 20 commands 143 to 44; reads while idle over 1.25 s, 10 to 0 |
PR #11's A/B used a local database, so its milliseconds say nothing about a remote one. Its round-trip counts are the useful part: they carry over to any distance.
The PR also wrote down a prediction: at the production pooler's 60 ms, four fewer sequential round trips should save roughly 240 ms per command. Nothing had measured the PR #10 build at 60 ms, so that number could never be checked like for like. What we could check was whether a player still waited seconds.
What a player waits for now
On 2026-09-27, from 05:27Z to 05:46Z, we played 5 games against build 6ae8af3a (version 1.0.0-beta.9), which contains both fixes. It ran on a VPS in Phoenix, against the PROD project's pooler. The full workload is in How we measured.
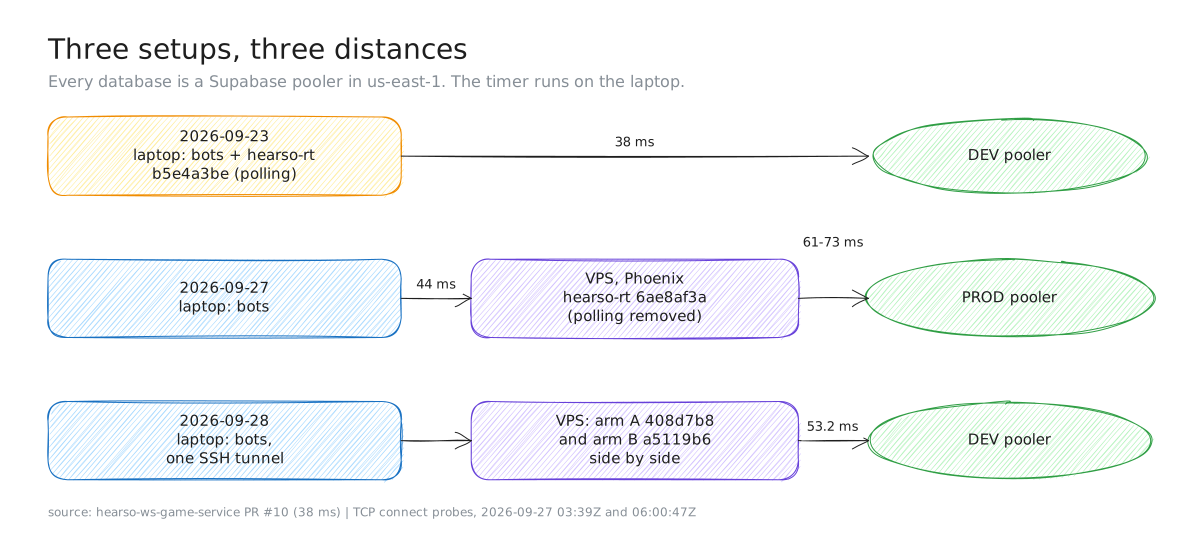
Figure 1. The three setups in this post. Distances are TCP connect medians (VPS to PROD pooler, 3 runs of 10, 2026-09-27 03:39Z; laptop to VPS, 10 connects, 06:00Z) and a 20-query round trip (VPS to DEV, 2026-09-28 08:20Z).
Every answer was accepted, and no socket closed unexpectedly. Here is how the answer times compare across the three builds:
room.answer on the client | 2026-09-23, b5e4a3be | 2026-09-23, after PR #10 | 2026-09-27, 6ae8af3a |
|---|---|---|---|
| p50 | 3,658 ms (one run 10,255 ms) | 1,157-1,277 ms | 328 ms |
| p95 | not recorded | not recorded | 682 ms |
| Slowest | 20,572 ms | 2,805 ms | 969 ms |
| No reply within 10 s | 22 of 41 commands | 0 | 0 of 136 commands |
| Service to database | 38 ms | 38 ms | 61-73 ms |
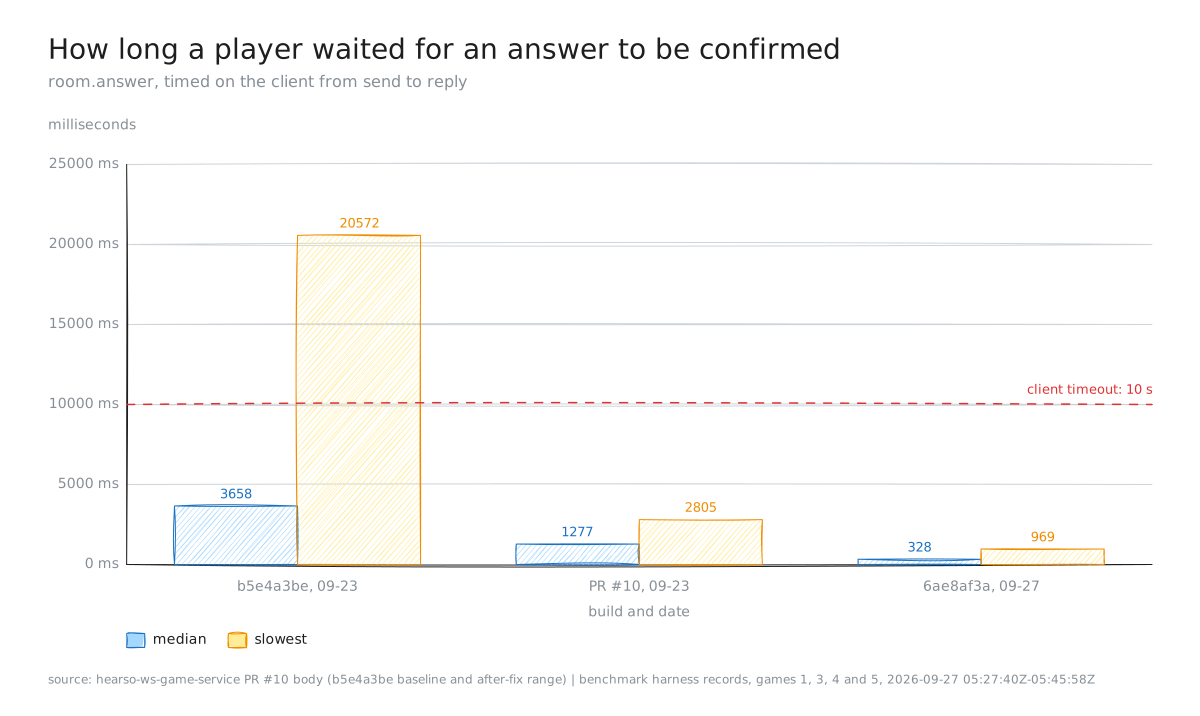
Figure 2. room.answer reply time on the client. 2026-09-23: laptop service, DEV 38 ms away. After PR #10: the top of a 1,157-1,277 ms range of medians. 2026-09-27: 110 answers in 4 games.
The other commands, from the same four games, are in the appendix: room.start about a second, room.rematch 710 ms, room.leave 226 ms at the median.
Why we quote no speed-up factor
It is tempting to divide 3,658 by 328 and call it a speed-up. We don't, because the two runs differ in more than the code. A reader should know which way each difference pushes:
- Different databases. DEV on 2026-09-23 and PROD on 2026-09-27: two projects in the same region, behind the same kind of pooler. We did not record the load on either.
- Different distance. The service sat 38 ms from its database before, and 61-73 ms after.
- A new client hop. Before, the bots and the service shared a laptop. After, every command added a network round trip of about 44 ms, over TLS.
- A different harness. Both wrap the same bot transport and time the same span, but they are different scripts.
- No same-path A/B. We did not run the old build on the new path.
The longer distance and the new hop both add time, so they work against the new build. The change of database could push either way.
So Figure 2 shows that the result holds up at a real distance, and PR #11's A/B shows why. We don't rest the cause on these two runs.
The histogram's median was a guess
The client was not the only thing timing these answers. The service's own histogram put the median answer at 390 ms. The client measured 328.
A histogram is a row of pigeonholes labelled "up to 250 ms", "up to 500 ms", and so on. You know how many letters landed in each hole, but not where inside it. The sum and the count are exact, so means are exact. A percentile is interpolated, on the assumption that samples spread evenly inside their bucket.
Here, 125 of the 140 answers landed in the 250-500 ms bucket, and nothing in the histogram can say where. The exact server mean over the same 140 answers was 329 ms. So for the server we report exact means and bucket counts, and we leave percentiles to the client, where every sample was timed.
Where the rest of an answer goes
Means add up, and percentiles do not. So to split one answer into parts, we use means.
The server's answer time is the mailbox wait plus one transaction. The mean mailbox wait was 46.3 ms and the mean record_answer transaction 282.3 ms, which add to 328.6 ms: the server mean exactly. The reply leaves right after the transaction commits.
| Part | What we saw | What it means |
|---|---|---|
| Mailbox wait | 110 of 140 answers waited 5 ms or less; 13 waited 250-500 ms | Answers that arrive together queue behind each other, as the clerk analogy says |
| Pool acquire | All 159 transactions waited 50-100 ms, mean 56 ms. The pool had 4 of 8 connections open, all idle, at the end | Not contention: about one round trip |
record_answer | All 140 took 250-500 ms, mean 282 ms, including the acquire | Roughly four round trips at 61-73 ms each (our arithmetic, not a count) |
| Single statements | load_room_with_players: 301 runs, mean 112 ms, every one of them 100-250 ms | One round trip would finish under 100 ms, so each costs about two |
Two rows look odd. Why does taking an idle connection cost a round trip, and why does one statement cost two?
Our guess was a default. hearso-rt builds its pool with sqlx and sets only the size. In sqlx 0.9.0, test_before_acquire defaults to true: before handing out an idle connection, the pool pings the database to check it is still alive. Beside the database, that is free. At 61 ms, it is one round trip on every checkout. We wrote that down on 2026-09-27 as a hypothesis, not a finding.
The same run turned up four more things worth knowing.
room.start took about a second. Its start_game transaction averaged 349 ms. We did not break down the rest.
finish_room is the slowest operation. It is the transaction that closes a game: 5 runs, mean 1,021 ms, three of them 1,000-2,500 ms. It runs in the room actor when the last question closes, and the results screen is published after it.
Rematch votes queue behind each other. Before this run we assumed they waited behind finish_room. The data says otherwise. The last answer of each game was sent about 18 s before the votes, and the votes formed a staircase:
| Game | Seats | 1st reply | 2nd reply | 3rd reply |
|---|---|---|---|---|
| 1 | 3 | 508 ms | 1,022 ms | 1,549 ms (409) |
| 3 | 3 | 334 ms | 708 ms | 1,046 ms (409) |
| 4 | 3 | 425 ms | 924 ms | 1,316 ms (409) |
| 5 | 2 | 321 ms | 710 ms (409) | - |
All the votes in a game left within 1 ms of each other. The room handled them one at a time, so each waited for the ones before it. The server agrees: rematch commands spent a mean of 557 ms in the mailbox. The last vote in each room got a 409, because the rematch had already closed.
Pings were labelled as server errors. The server recorded all 280 keep-alive pings with status class 5xx. None failed. In build 6ae8af3a, the command engine answered any command it did not handle with a 503; the actor recorded that status, and the socket layer then replaced the reply with a normal pong. An alert on the 5xx rate would have fired on healthy rooms. (Update, 2026-09-27: fixed in PR #19, merged at 14:33Z. The engine now answers a ping with 200.)
Pings also go through the room's mailbox. At most once every 10 s per socket, a ping writes the player's presence: 217 writes, mean 114 ms, holding the room while they run.
One line of config, one round trip
On 2026-09-28, from 08:18Z to 09:02Z, we tested the pool guess on DEV. Two builds ran side by side as fresh containers on the VPS:
- Arm A: the live build
408d7b8, run from its existing image. - Arm B: the same commit with one line added,
test_before_acquire(false).
We played 10 one-game rooms, alternating A, B, A, B, each with 3 bots and 10 questions and the same human-like pauses. First, we measured the yardstick: one round trip from the VPS to DEV took 53.2 ms (median of 20 queries).
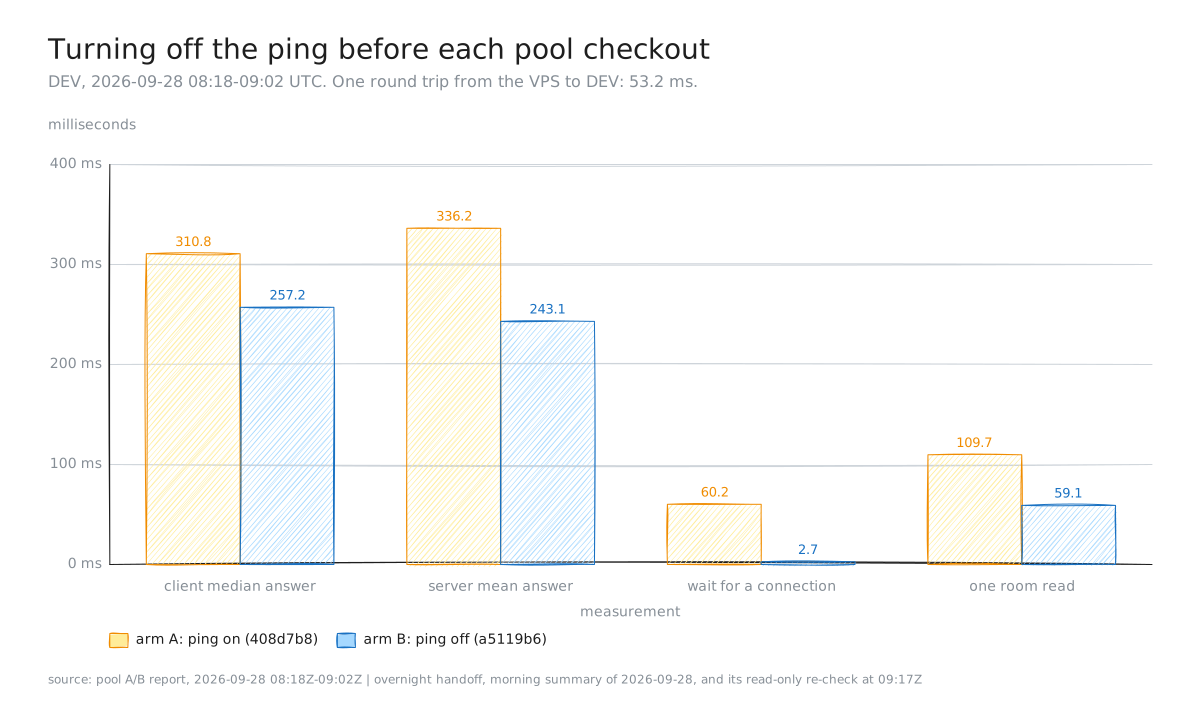
Figure 3. The pool A/B on DEV, 2026-09-28 08:18Z-09:02Z: 150 answers per arm, 5 games each, interleaved. Client median; server exact means from the /metrics difference.
room.answer, 150 per arm | A: ping on | B: ping off | Difference |
|---|---|---|---|
| Client median | 310.8 ms | 257.2 ms | -53.6 ms (1.01 round trips) |
| Client p95 | 653.5 ms | 487.9 ms | -165.6 ms |
| Client slowest | 1,044.6 ms | 640.1 ms | -404.5 ms |
| Server mean | 336.2 ms | 243.1 ms | -93.1 ms (1.75 round trips) |
| Wait for a pooled connection | 60.2 ms | 2.7 ms | -57.5 ms |
load_room_with_players | 109.7 ms | 59.1 ms | -50.6 ms |
| Timeouts | 0 | 0 |
The guess held. The client median fell by 53.6 ms, one round trip, and every B game's median was below every A game's. That round trip was 17% of arm A's median answer.
The server saved more, 93 ms. The answer's own transaction lost one round trip, and answers also waited less behind other commands in the same room (queue wait 61.7 to 22.5 ms). Single statements went from about two round trips to one. The pings were clean this time: 297 and 298, all 2xx.
That is the clerk again. When one command gets shorter, so does the wait of every command behind it.
The A/B has limits, and here they are. It is one run per arm, on DEV, through one SSH tunnel. Arm B's image was built a day after arm A's, from the same Dockerfile, so their base layers may differ. The change sits on an unmerged branch and is not in production.
Predictions vs outcome
| Prediction | What happened | Right? |
|---|---|---|
| Green certification runs, all beside a local database, meant the service was ready | 22 of 41 answers got no reply within 10 s at 38 ms | No |
| PR #11: at 60 ms, four fewer round trips save about 240 ms per command | Not measured like for like; the median went from 1,157-1,277 ms (DEV, 38 ms) to 328 ms (PROD, 61-73 ms), with 0 timeouts | Untested |
| The histogram's median (390 ms) describes the server | The exact mean was 329 ms, the client median 328 ms | No |
Rematch votes wait behind finish_room | They queued behind each other: a mean of 557 ms in the mailbox | No |
| The pool's ping costs one round trip per checkout | -53.6 ms at the client median against a 53.2 ms round trip | Yes |
Key takeaways
- Test at the distance you will run at. The polling design cost 7 ms beside its database and 3.7 s at 38 ms.
- Count round trips, not milliseconds. Round trips carry over between setups; milliseconds do not.
- Remove the loop, not only its queries. Fewer queries per tick helped; removing the tick is what took round trips per command from 6 to 2.
- Split a request with means, report the whole with percentiles. Means add up; percentiles do not.
- Report exact means beside histogram quantiles. When most samples share one bucket, a quantile is an assumption.
- Check a library's defaults at a distance. A liveness ping that is free locally cost one round trip on every checkout.
What we'd do next
- Ship the pool change. Merge it, deploy it, and re-measure against PROD.
- Cut
finish_room. Count its statements and round trips. In the A/B it took 979 ms with the ping and 790 ms without, still the slowest thing a room does. - Run many rooms at once. A saturation run that watches the pool gauges and the VPS's CPU.
- Finish the prerequisites that are not latency. A WebSocket game's scores must reach the leaderboard: when we ran this, the event relay on the VPS read only DEV. (Update, 2026-09-27: a second relay, for PROD, went live on the VPS later that day, and the service now accepts the app's new domain as an origin. A real WebSocket score reaching the PROD leaderboard was still not verified on 2026-09-28.)
How we measured
Workload
- 5 games, one after another. Four had 3 seats and one had 2. Each game had 10 questions, so 140 answers in total.
- Human-like pauses. Each bot answered a random 0.3 to 3.5 s after a question arrived. The host started each game as soon as all seats were in.
- The end of a game. Every seat declined a rematch at the same moment, then the seats left one by one. So
room.rematchandroom.leavewere measured too. - Accounts and rooms. Three test accounts took the seats. A copy of our web app running on the laptop created the rooms, so only these five rooms used WebSockets.
- Nobody else on the service. Production rooms still poll through the web app and never reach the VPS.
This is a latency test, not a saturation test. One room was open at a time, with at most three players.
| 2026-09-23 (before) | 2026-09-27 (after) | |
|---|---|---|
| hearso-rt build | b5e4a3be, then PR #10's branch | 6ae8af3a (1.0.0-beta.9) |
| Where the service ran | A laptop | A VPS in Phoenix: 2 vCPU, 8 GiB |
| Database | DEV project, through its pooler in us-east-1 | PROD project, through its pooler in us-east-1 |
| Service to database | 38 ms | TCP connect medians 61, 63 and 73 ms |
| Client to service | Same machine, no network hop | TCP connect median 44 ms (min 39, max 89) |
| Client | Our bot kit's WebSocket transport, 10 s reply timeout | The same |
| Where the timer sits | On the client: command sent to reply received | The same |
On the client
The harness notes the time before it sends a command and again when the reply with that command's id arrives. It writes one record per command: its type, when it was sent, how long it took, the status, and whether it timed out. Percentiles use linear interpolation between ranks.
The file for game 2 was not kept, so client numbers cover games 1, 3, 4 and 5: 110 answers. Game 1's record lists two 4003 closes as errors. Those are the service closing seats that had just left, which the harness counted as unexpected until it was corrected after game 1.
With 11 samples or fewer, a p95 or p99 is just the largest value under another name, so those cells are left empty in the appendix.
On the server
hearso-rt exposes Prometheus histograms on /metrics. We saved them at 05:22:49Z and 05:46:03Z. The process start time was the same in both, so the service did not restart, and subtracting the first from the second leaves only the benchmark. The server side covers all five games.
This is the interpolation that produced the misleading 390 ms:
def quantile(buckets, phi):
    """Linear interpolation inside a cumulative histogram {upper_bound_s: count}.
    This is what produced "p50 = 390 ms"."""
    total = buckets[float("inf")]
    rank, prev_le, prev_c = phi * total, 0.0, 0.0
    for le in sorted(buckets):
        c = buckets[le]
        if c >= rank:
            return prev_le + (le - prev_le) * (rank - prev_c) / (c - prev_c)
        prev_le, prev_c = le, c
What we did not test
- Saturation. One room at a time, at most three players. Many rooms at once, the pool of 8 connections, and the VPS's 2 vCPUs under load are all untested.
- Large rooms. Each command held its room for a mean of 216 ms (453 commands, pings included). A room runs one command at a time, so twenty players answering in the same second would queue. We have not measured that.
- The production web path. The web app ran on a laptop. Creating a room took 0.78-1.57 s and opening a socket 0.75-1.80 s, but through a laptop those numbers say nothing about production, so we do not report them as results.
- Duration. Nineteen minutes, five games. This was not a soak test.
- Real players. Bots only, on test accounts.
How to reproduce it
- Pin the build. Read the service's
/healthand record its build sha. Ours reported6ae8af3awith no uncommitted changes. - Measure the distances. Open ten TCP connections from the service host to the database pooler, and ten from the client to the service host. Record min, median and max.
- Snapshot
/metrics, and note the process start time. - Play the games one after another. Time each command on the client, from send to its reply, and keep one record per command. Use human-like pauses.
- Snapshot
/metricsagain. Check that the process start time did not change, then subtract. - Report honestly. Client percentiles with their n. Server exact means with bucket counts. The confounds, and which way each one pushes.
Appendix: the full results tables
On the client (2026-09-27, games 1, 3, 4 and 5, 136 commands, 0 timeouts):
| Command | n | p50 | p95 | p99 | max |
|---|---|---|---|---|---|
room.answer | 110 | 328 ms | 682 ms | 839 ms | 969 ms |
room.start | 4 | 1,004 ms | - | - | 1,440 ms |
room.rematch | 11 | 710 ms | - | - | 1,549 ms |
room.leave | 11 | 226 ms | - | - | 339 ms |
On the server (2026-09-27, all five games, from the histogram difference):
| Command | n | Exact mean | Where the samples fell |
|---|---|---|---|
room.answer | 140 | 329 ms | 125 in 250-500 ms, 15 in 500-1,000 ms |
room.start | 5 | 963 ms | 3 in 500-1,000 ms, 2 in 1,000-2,500 ms |
room.rematch | 14 | 772 ms | 5 in 250-500 ms, 5 in 500-1,000 ms, 4 in 1,000-2,500 ms |
room.leave | 14 | 219 ms | 11 in 100-250 ms, 3 in 250-500 ms |
The pool A/B, other operations (2026-09-28, server exact means):
| Operation | A: ping on | B: ping off |
|---|---|---|
stamp_presence | 110.8 ms | 57.4 ms |
reveal_question / advance_question | 113.8 / 115.6 ms | 62.4 / 63.4 ms |
start_game | 503.0 ms | 349.9 ms |
finish_room (n 5) | 979.3 ms | 790.4 ms |
| Ping, server mean | 109.0 ms (297, all 2xx) | 61.9 ms (298, all 2xx) |
Evidence
All times UTC.
- 2026-09-23 baseline and PR #10 (the first tables, Figure 2): hearso-ws-game-service PR #10, merged 2026-09-23T16:06Z as
700ae6c5. Its body: the local-vs-DEV A/B onb5e4a3be(7 vs 3,658 ms p50, one run 10,255; 21 vs 20,572 ms max; 0 vs 22 of 41 unanswered), about 342 ms of polling per 250 ms tick, 2,511 transactions for one game, the three green certification cycles and 60-minute soak, and the after-fix p50 of 1,157-1,277 ms, max 2,805 ms. - PR #11: merged 2026-09-24T00:27Z (
ad2624f). Its body: round trips per command 6 to 2, statements for 20 commands 143 to 44, idle reads 10 to 0, all on a local database; and the estimate of roughly 240 ms saved per command at 60 ms. - 2026-09-27 client numbers (the answer tables, Figure 2's last group, the rematch table, the appendix): harness records for games 1, 3, 4 and 5, 05:27:40Z-05:45:58Z; 136 commands, all
timedOut: false.room.answern = 110: p50 327.9, p95 681.7, p99 839.0, max 969.2 ms, mean 397.1 ms.room.startn = 4: p50 1,004.2, max 1,440.4.room.rematchn = 11: p50 710.2, max 1,549.4.room.leaven = 11: p50 226.2, max 338.8. The handoff entry at 05:46Z records the same 328 / 682 / 969 ms and 0 timeouts. The raw files were temporary and are no longer kept. - 2026-09-27 server numbers (the parts table, the appendix):
/metricsat 05:22:49Z and 05:46:03Z,process_start_time_secondsidentical,hearso_rt_build_infoversion 1.0.0-beta.9, sha6ae8af3a.room.answern = 140, mean 328.6 ms; queue wait mean 46.3 ms;record_answern = 140, mean 282.3 ms; pool acquire n = 159, mean 55.6 ms, all in the 0.05-0.1 s bucket;load_room_with_playersn = 301, mean 112.5 ms, all in 0.1-0.25 s;start_gamemean 349.1 ms;finish_roomn = 5, mean 1,020.5 ms; rematch queue wait n = 14, mean 556.9 ms; ping n = 280, allstatus_class="5xx";stamp_presencen = 217, mean 114.3 ms; room actor command iterations n = 453, mean 215.7 ms. Pool gauges after the run: 4 connections, 4 idle, maximum 8. - Which operations are transactions:
record_answer,record_vote,start_gameandfinish_roomtake a connection explicitly at6ae8af3a; 140 + 9 + 5 + 5 = 159, the pool-acquire count. - The ping label and its fix: hearso-rt at
6ae8af3a(the engine's fallback 503, the actor'sobserve_command, the socket layer's pong); PR #19, merged 2026-09-27T14:33Z. - The pool default: hearso-rt builds its pool with
PgPoolOptions::new().max_connections(8); sqlx-core 0.9.0 setstest_before_acquire: trueby default. - Distances (Figure 1, the setup table): VPS to PROD pooler, three runs of 10 TCP connects at 03:39Z on 2026-09-27, medians 61, 63 and 73 ms; laptop to VPS, 10 connects at 06:00:47Z, min 39, median 44, max 89 ms; VPS to DEV, 20 sequential
select 1at 08:20Z on 2026-09-28, p50 53.2 ms. - The pool A/B (Figure 3, its tables): the A/B report, 2026-09-28 08:18Z-09:02Z; arm A
408d7b8(live image), arm Ba5119b6(one line, unmerged); 10 games interleaved; per-game medians (A 307.5-325.6 ms, B 255.4-260.4 ms). The handoff's morning summary of 2026-09-28 and its independent read-only check at 09:17Z. - The VPS and the deploy: handoff entry 05:30Z on 2026-09-27 (build
6ae8af3adeployed, health sha confirmed). - Think time and the rematch-and-leave sequence: the harness source (a pause of 300 ms plus up to 3,200 ms before each answer).
- The relay and origin updates: handoff entries 2026-09-27 14:25Z (rt allows the app's domain) and the transport-dial design's prerequisite table (a real WebSocket score on the PROD leaderboard: not verified).
The 2026-09-27 run used three test accounts on the production database and five rooms under them; the A/B used DEV and one throwaway test host. No credential, token, internal address, room code or player identity appears in this post or its figures.