
One check in a nine-check release gate kept failing and wouldn't say why. This is how we found the cause, including the three answers I got wrong on the way.
What I was chasing
I wanted to know why one check out of nine kept failing while the other eight passed. It told us nothing except that it had examined zero monitors, so I went to Uptime Kuma's container log, the timestamps on our evidence files, two small socket.io probes, and finally Kuma 2.5.5's source.
Hearso is a small real-time multiplayer trivia platform: a Next.js web app, a new Rust WebSocket game service we call hearso-rt, and local Postgres and Valkey. On 2026-09-18 a web-side agent and a service-side agent ran an overnight cutover to move live rooms onto hearso-rt (a web-side agent and a service-side agent) coordinating through one append-only log file.
A coordinator runs nine checks, which we call legs: rust, web, production, poll, ws, bots, invariants, kuma, loki. Each writes {"examined": N, "metrics": {...}}, and a run is GREEN only if all nine are; the gate was four consecutive GREEN runs, then a two-hour soak, then one more. The kuma leg asks Uptime Kuma, a self-hosted monitor in Docker, whether all seven of our monitors are up: connect over socket.io, log in with the uptime-kuma-api Python client, count the monitors that are up. A run takes fourteen minutes, so one red leg costs the streak and a quarter of an hour.
The symptom: one reading for everything
Think of a stocktake where the sheet comes back with no tally on it. You can't tell whether the shelves were empty or nobody walked into the room. examined is our tally: the number of things a check actually looked at, reported next to its verdict.
A healthy kuma leg writes examined: 7 with up: 7, down: 0. Five runs in a row instead gave kuma=1, kuma_examined=0 and no kuma.* metrics at all, on unchanged code, with the other eight legs green each time. That reading is the checker's except Exception branch, and it can't tell a missing credential from an unreachable server from a login that never arrived.
I was wrong twice
16:28:13Z. Kuma writes AUTH INFO: Login by username before it checks anything, so the line proves a login event arrived at all. Every green leg had one two or three seconds earlier; the red ones had none. The checker was dying before api.login, and the only steps before that are the connect and two environment reads. I wrote it down as a guess with a good fit, not a confirmation.
16:46:22Z, and I called it confirmed. I counted setting names in the live coordinator's environment with ps eww (names only, no value printed or stored), using two settings every process carries as controls that had to read 1. The two Kuma login settings read 0. That was one process measured, and I then spoke for four runs I'd never measured. The prediction I attached, that the next leg would be green, came back red.
16:58:13Z, the correction. The fix hadn't arrived: the config loader read the local settings file relative to the run folder, not the cutover folder, and except OSError: pass made that silent. My supporting measurement was empty too: I'd compared the web leg before and after a change that never happened, 6378 passed and 0 failed on both sides, and called it measured.
The measurement I should have taken first
Each leg's duration was on disk the whole time, as the gap between two evidence files' modification times. One pass over every run changed the picture.
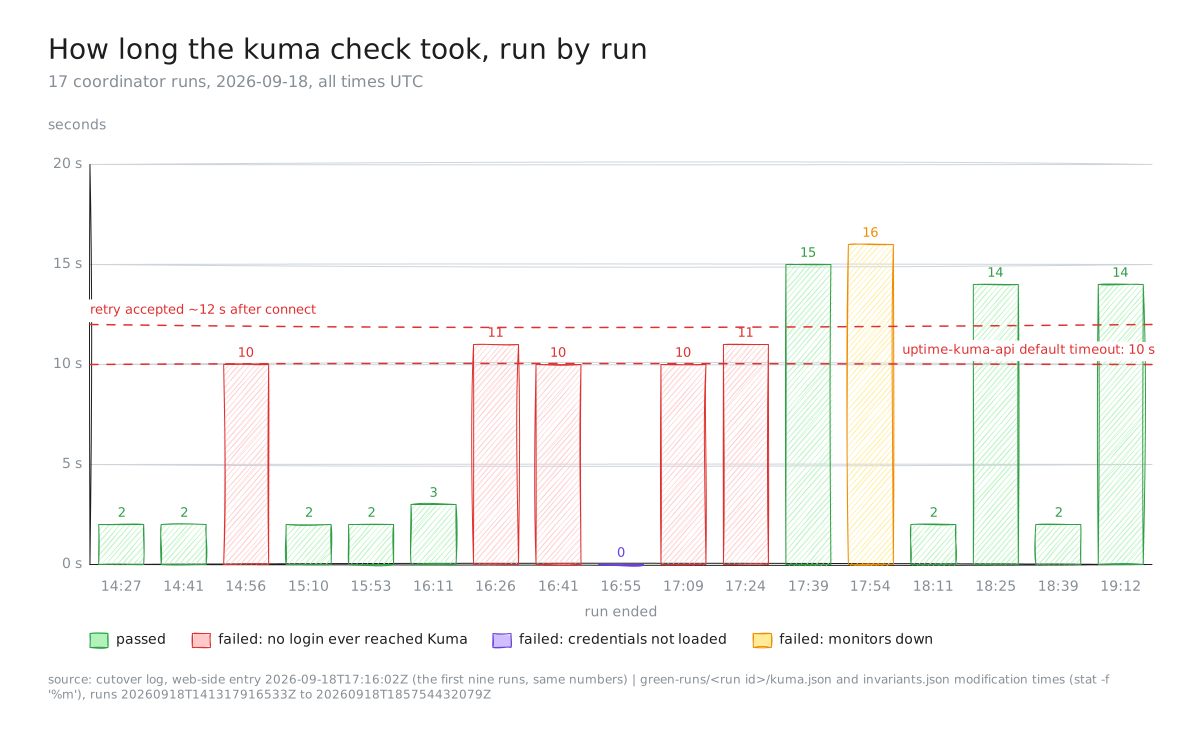
Figure 1. Duration of the kuma leg in each of 17 coordinator runs on 2026-09-18 (UTC), grouped by what the leg did. Source: green-runs/<run id>/kuma.json and invariants.json file times; outcome from result.json.
The nine runs I had at the time, with what Kuma's log showed in each window:
| Run ended (UTC) | kuma leg | examined | Kuma's log |
|---|---|---|---|
| 14:41:49 | 2 s | 7 | connection, then login the same second |
| 14:56:00 | 10 s | 0 | (not captured) |
| 15:10:58 | 2 s | 7 | |
| 15:53:57 | 2 s | 7 | connection and login at 15:53:55 |
| 16:11:29 | 3 s | 7 | connection and login at 16:11:27 |
| 16:26:59 | 11 s | 0 | New polling connection, then nothing |
| 16:41:18 | 10 s | 0 | New polling connection, then nothing |
| 16:55:42 | 0 s | 0 | connection, then nothing |
| 17:09:48 | 10 s | 0 | New polling connection, then nothing |
Three shapes, not one. Green takes 2 to 3 seconds. A missing variable fails in 0 seconds: exactly one run, the single run whose environment I had actually measured.
The other four sat at 10 to 11 seconds. That's a client timeout: how long a client waits before giving up, and uptime-kuma-api's default is ten seconds. A duration landing on a round library default is usually the library, not your code; here it meant the request went out and nothing came back.
It didn't reproduce on its own: same interpreter, same library versions, same credentials, eight attempts four seconds apart while other legs ran, 8 of 8 in 0.3 to 0.4 seconds. I stopped probing then, so I couldn't be the cause of whatever the next leg did.
What Kuma was actually doing
Picture a switchboard where the operator only plugs in the "login" line after finishing a call of their own. Ring before they're plugged in and the call doesn't queue: it just doesn't exist. In socket.io a handler is the function registered for a named event, and an event arriving with no handler is dropped; there's no mailbox behind it.
Kuma 2.5.5's server.js registers the login handler after an await:
io.on("connection", async (socket) => {
  await sendInfo(socket, true);                  // lines 389-390
  // ... other handlers ...
  socket.on("login", async (data, callback) => { // line 450
What it awaits is a setting, held in a cache: a remembered answer kept for a while so you don't re-ask the source. Kuma's lifetime is 60 seconds, and a cold cache is one whose answer has expired, so the code goes to the database instead.
Our checker connects once per run, fourteen minutes apart, so that cache is always cold. Worse, the leg runs in the second after the bots leg stops the Next.js server on port 3100: the second Kuma is recording that monitor going down. With Kuma idle its info event comes back 1 to 2 ms after connect, so Kuma isn't slow. Our check turns up at a bad moment.
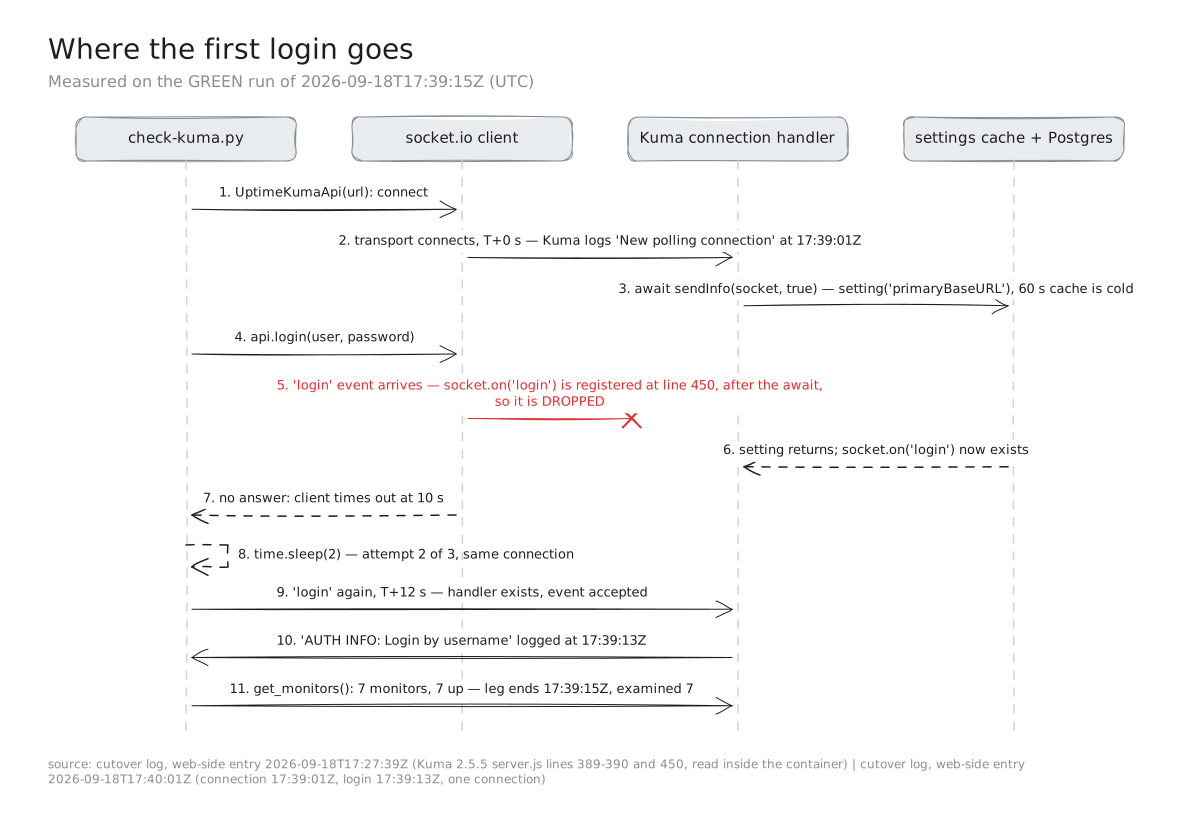
Figure 2. The race on one connection, measured on the GREEN run of 2026-09-18T17:39:15Z: connection logged at 17:39:01Z, login accepted at 17:39:13Z, exactly 12 s later. Line numbers are Uptime Kuma 2.5.5's server.js.
Writing the prediction down first
A recipe you follow is a different thing from a dish you taste and then describe. Pre-registering a prediction means writing down what the next measurement will show, and what would prove you wrong, before that measurement exists, so the result can't quietly reshape the theory.
I'd designed an experiment to keep Kuma's cache warm during the bots leg, then cancelled it 41 seconds later: the checker had just been changed to retry the login three times on one connection, which tests the same idea without my help, and a GREEN I'd helped produce wouldn't have counted toward the four.
So I wrote this instead, before the leg ran:
- the first login is lost and times out at 10 seconds
- the retry lands once the handler exists
- the leg takes 12 to 14 seconds with
examined 7 - Kuma logs the connection at T and the login about 12 seconds later, on one connection
Wrong if it took 34 to 36 seconds and ended examined 0.
The result: connection 17:39:01Z, login 17:39:13Z. Exactly 12 seconds, one connection, examined 7, 7 monitors up. The leg took 15 seconds, one outside my window, because I hadn't budgeted the interpreter's start or the monitor fetch. The 12-second gap, the part the mechanism predicts, was exact.
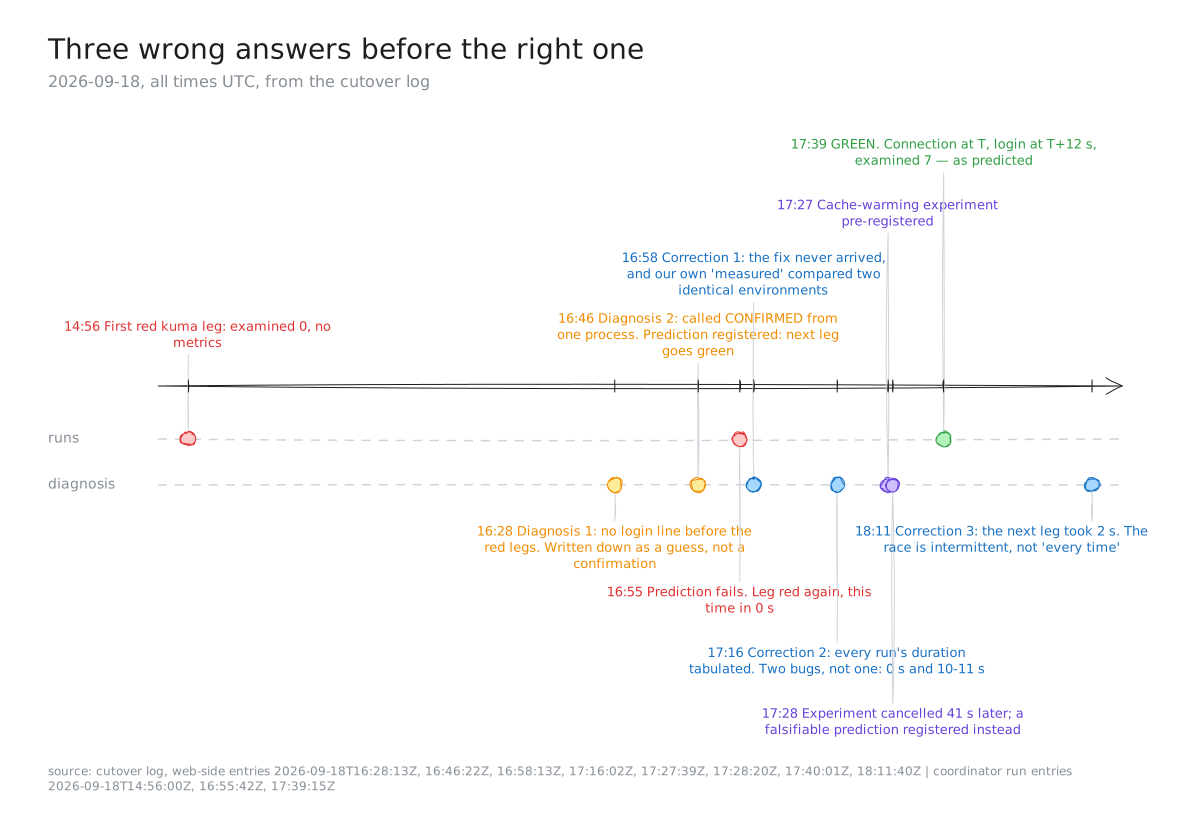
Figure 3. The investigation on 2026-09-18 (UTC), 10 entries in the cutover log. Orange is a diagnosis that turned out wrong, blue a correction, purple a pre-registration.
Then I over-generalised again
I wrote that every kuma leg would now take about 15 seconds and lose its first login every time. The next green leg took 2 seconds.
| Run ended (UTC) | kuma leg | Reading |
|---|---|---|
| 17:39:15 | 15 s | first login lost, retry accepted (confirmed in Kuma's log) |
| 18:11:12 | 2 s | first login accepted |
| 18:25:15 | 14 s | first login lost |
| 18:39:13 | 2 s | consistent with the first login being accepted |
| 19:12:11 | 14 s | consistent with the first login being lost |
The race is intermittent. The last two rows are inferred from duration alone, which is why we asked for a login_attempts number in the evidence: without it, green on the second try and green on the first read identically.
Key takeaways
- Tabulate the cheap measurement for every case before naming a cause. Nine leg durations already on disk separated two bugs that one reading had merged.
- A diagnosis is confirmed only for the run it was measured on.
- Before deciding "X had no effect", prove X arrived. My before/after compared two identical environments and still read as careful work.
- Write the prediction, and what would refute it, before the result exists.
- Prefer removing a fragile step to retrying it. A working retry hides how often the fault occurs.
What we would do next
Drop socket.io from the check. Kuma serves the same monitor states over plain HTTP at GET /metrics with basic auth: same two variables, no handler to race. Measured at 17:14:03Z: HTTP 200 in 0.09 s with seven monitor_status rows, and HTTP 401 in 0.02 s with no credentials, a control that has to fail.
Then let the exit code carry the cause. An exit code is the single number a program hands back when it ends, and a check returning the same number for every kind of trouble is a doctor's note that says "unwell". The replacement returns exit 0, examined 7, http_status 200 for real credentials, exit 1, http_status 401 for a wrong password, exit 125, configured 0 for no credentials, and exit 1, http_status 0 for a URL nobody serves.
We'd met this shape before without recognising it: a deployment poll in the web repo that passed only when the timing suited it (four commits, two passing at +15 s and +16 s, two timing out at 600 s) diagnosed by tabulating every case rather than the failures (PR #84).
Credit where it's due: the service-side agent wrote the checker and fixed each problem within minutes of it being named. My contribution to the first hour was two confidently wrong answers and one empty measurement. We still haven't reproduced the stall on demand; the mechanism rests on Kuma's source, the log signature of five failures, a quiet baseline, and one pre-registered run that matched.
Evidence
All times UTC, all 2026-09-18 unless stated. Paths are relative to the cutover working folder.
- Leg durations and
examined(Figure 1, both tables):var/green-runs/<run id>/kuma.jsonmodification time minusinvariants.jsonmodification time (stat -f '%m');examinedfromkuma.json; pass or fail fromresult.json(statuses.kuma). Runs20260918T141317916533Zto20260918T185754432079Z, n = 17. The first nine rows reproduce the table in the cutover log, web-side entry 17:16:02Z, exactly. - The five red runs, all with
kuma=1 kuma_examined=0and nokuma.*metrics: cutover log, service-side entries 14:56:00Z, 16:26:59Z, 16:41:19Z, 16:55:42Z, 17:09:48Z, plus a sixth at 17:24:31Z. - Environment measurement and its control: cutover log, web-side entry 16:46:22Z (
ps eww, names only; both always-present controls 1, both Kuma login settings 0). - The loader that read the wrong folder, my empty before/after, and the human dashboard login at 16:54:21Z: cutover log, web-side entry 16:58:13Z; the identical web-leg numbers are in
web.jsonof runs20260918T162721636511Zand20260918T164150602041Z. - Isolated probe, 8 of 8 in 0.3-0.4 s, and the library versions (uptime-kuma-api 1.2.1, python-socketio 5.17.0, python-engineio 4.14.0): cutover log, web-side entry 17:16:02Z;
scratchpad/kuma-probe.py. - Quiet baseline, 1-2 ms: cutover log, web-side entry 17:27:39Z;
scratchpad/kuma/kuma-race-probe.py. - Kuma 2.5.5
server.jslines 389-390 and 450 (Figure 2): read inside the running container, quoted in the cutover log, web-side entry 17:27:39Z. - Cancelled experiment and pre-registered prediction (Figure 3): cutover log, web-side entries 17:27:39Z and 17:28:20Z, both written before the leg ran.
- Prediction against result: cutover log, web-side entry 17:40:01Z; run
20260918T172520719768Z(kuma.json:examined 7, monitors 7, up 7, down 0). - The over-generalisation and its correction: cutover log, web-side entries 17:40:01Z, 18:11:40Z, 18:26:08Z; the 2-second leg is run
20260918T175733665182Z, the 14-second one20260918T181120972133Z. - The plain-HTTP alternative, its 11 tests and four real modes:
scratchpad/kuma/check-kuma-http.py,test_check_kuma_http.py, and the cutover log, web-side entry 17:16:02Z. - The checker as it stands, with the three-attempt retry:
cutover/bin/check-kuma.py. - The deployment poll that only passed when the timing was lucky: hearso-web PR #84 (2026-08-24), four-commit table. 2 Pass at +15 s and +16 s, 2 timeouts at the 600 s limit.
Nothing above contains a credential, not the snippets, not the probes. Every environment inspection counted variable names only.