
Our WebSocket game service and our event-log relay moved off a laptop and onto a small rented server. This is what went wrong first, what we measured, what we can see now, and what is still only a plan.
It follows How an answer reaches every screen, We threw away 38 healthy minutes of a two-hour soak test and The morning a July cron job stopped every container on my Mac: the same service, now off the laptop.
What I wanted to know
I wanted to know three things about the Hostinger VPS that now runs our two real-time services. How far is it from the database? Can we see what it is doing? And what happens to a game when it breaks?
The tools were a ten-line TCP probe, Grafana Alloy shipping to Grafana Cloud, and a lot of reading what was already on the box before changing it. This post covers the answers, a near-miss in our own deploy kit, and the failover design we have agreed on but not built. Every planned part is labelled as planned.
Hearso is standup icebreaker trivia: a host opens a room, teammates join with a code, and ten questions run on a server clock. The web app is Next.js on Vercel. The database is Supabase Postgres in us-east-1, in Virginia.
Why a VPS at all
Production rooms today are polled. Every open room page asks Next.js for the room's state every 1,500 ms, and each ask is an HTTP request to Vercel and at least one query to Supabase. That is 40 requests a minute per player, whatever is happening in the game.
A WebSocket is the other way round. Think of a phone call instead of postcards: the connection stays open and the server speaks when something changes. Our Rust service, hearso-rt, holds one socket per player and pushes each change once.
We moved two services to a VPS for three reasons:
- Cost. Every poll runs on Vercel, and we pay for that compute.
- Fewer HTTP calls. A socket turns 40 requests a minute per player into a push per change, plus a keep-alive.
- Decoupling. Real-time rooms and the event log are separate services with their own failure modes. They should not share a deploy with the web app.
The second service is the Kafka event-log relay. When a WebSocket game finishes, hearso-rt writes a row to an outbox table in the same transaction. The relay reads that outbox and publishes each event to a Redpanda broker, a Kafka-compatible server, on the same box.
What else lives on that box
The VPS is a Hostinger "KVM 2": 2 vCPU and 8 GiB of RAM (7,940 MiB usable) in Phoenix, Arizona. It was not empty when we arrived, and that mattered twice.
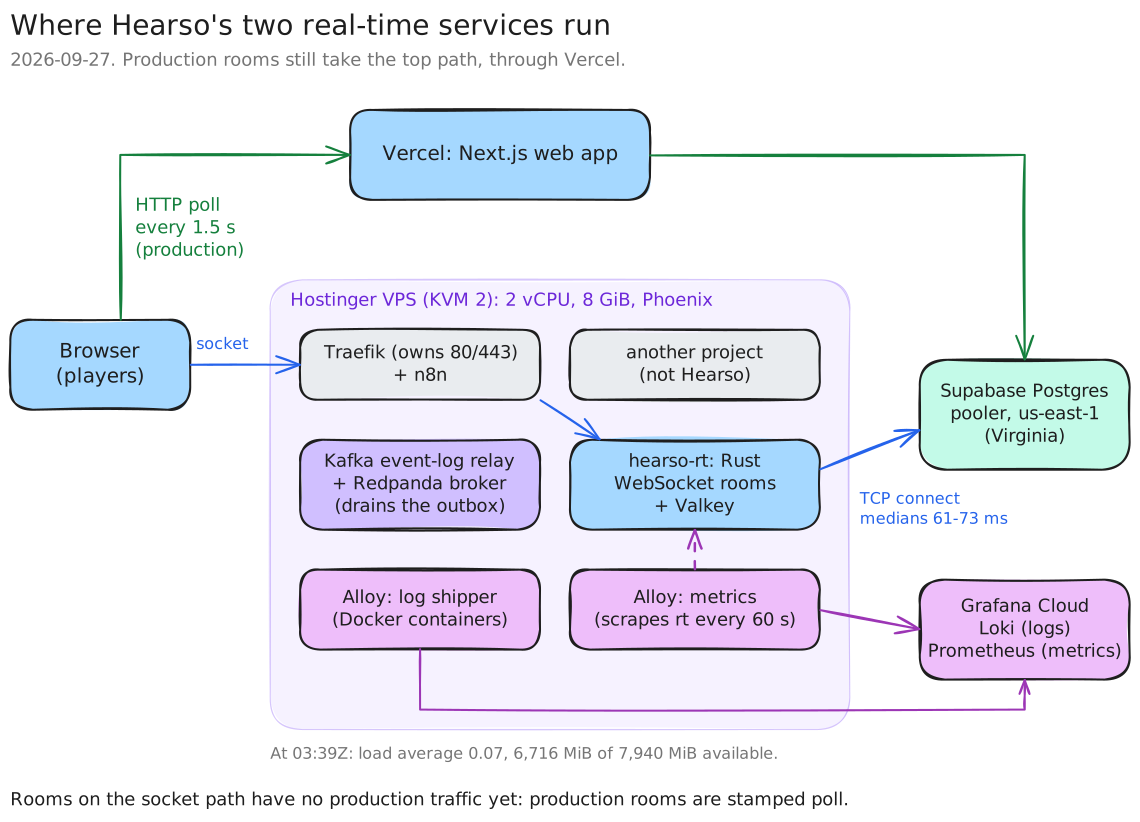
Figure 1. What runs where on 2026-09-27. Drawn in Excalidraw from the container list read on the VPS that night.
| On the box | What it is | Ours? |
|---|---|---|
| Traefik + n8n | A reverse proxy that owns ports 80 and 443, and an automation tool | No, it was there first |
| Another project | A separate app with its own cache | No |
| hearso-rt + Valkey | The Rust WebSocket game service and its cache | Yes |
| Kafka relay + Redpanda | Reads the outbox and publishes to the broker | Yes |
hearso-alloy | Ships container logs to Grafana Cloud Loki | Yes, set up separately, earlier |
hearso-alloy-metrics-1 | Scrapes hearso-rt's metrics every 60 s | Yes, new on 2026-09-27 |
The first time it mattered was on 2026-09-22. Our deploy kit had been written for an empty machine and started its own proxy on 443. Traefik already held 443 for n8n, so running the kit as written would have collided with it. We added a router to the existing Traefik instead, and nothing of the other projects was restarted.
At 03:39Z on 2026-09-27 the box read a load average of 0.07 with 6,716 MiB available. It has room. It is also one machine, and that is the main limit of everything below.
What went wrong first
On 2026-09-23 at about 01:45Z we switched production to WebSockets. The whole path worked: a room created through the production API was stamped ws, its socket upgrade answered 101, and the VPS logged the room's actor starting.
We switched it back at about 01:54Z, nine minutes later. A WebSocket game's scores reached no leaderboard yet, so a real player finishing one would have lost theirs. The switch was one setting, and the rest stayed in place.
The WebSocket testing moved to our DEV environment, and the bot runs there found the bigger problem. Commands went unanswered for so long that the bots reported them as server errors. None were. Our client gives up after 10 s, and it counted a timeout as a 5xx.
We ran an A/B test with the same binary, the same bots and the same commands. Only the database changed:
room.answer reply | DEV database through the pooler (38 ms from the laptop) | Local Postgres |
|---|---|---|
| p50 | 3,658 ms, one run 10,255 ms | 7 ms |
| max | 20,572 ms | 21 ms |
| unanswered within 10 s | 22 of 41 | 0 |
The cause was in the room actor. It woke every 250 ms and re-read the whole room, three queries at a time, up to three times per tick. At 38 ms a round trip that is about 230 ms of database time in a 250 ms period, and commands queued behind it. One game took 2,511 database transactions. A partial fix brought the p50 to 2,702 ms, which was an improvement and not a fix.
The real fix landed in hearso-rt PR #11 (ad2624f). The actor no longer polls: it wakes for a command, a deadline, or a signal that someone else changed the room. Nobody has measured command latency against a remote database since then. That is the next number we need.
One more lesson from that night. /health stayed green the whole time. A health check asks "is the process up?", and the answer was yes.
Tonight's measurement
The first question is distance. At 03:39Z on 2026-09-27 I ran our probe on the VPS against Supabase's connection pooler in us-east-1. It opens a TCP connection ten times and times each one. It sends no password and no query.
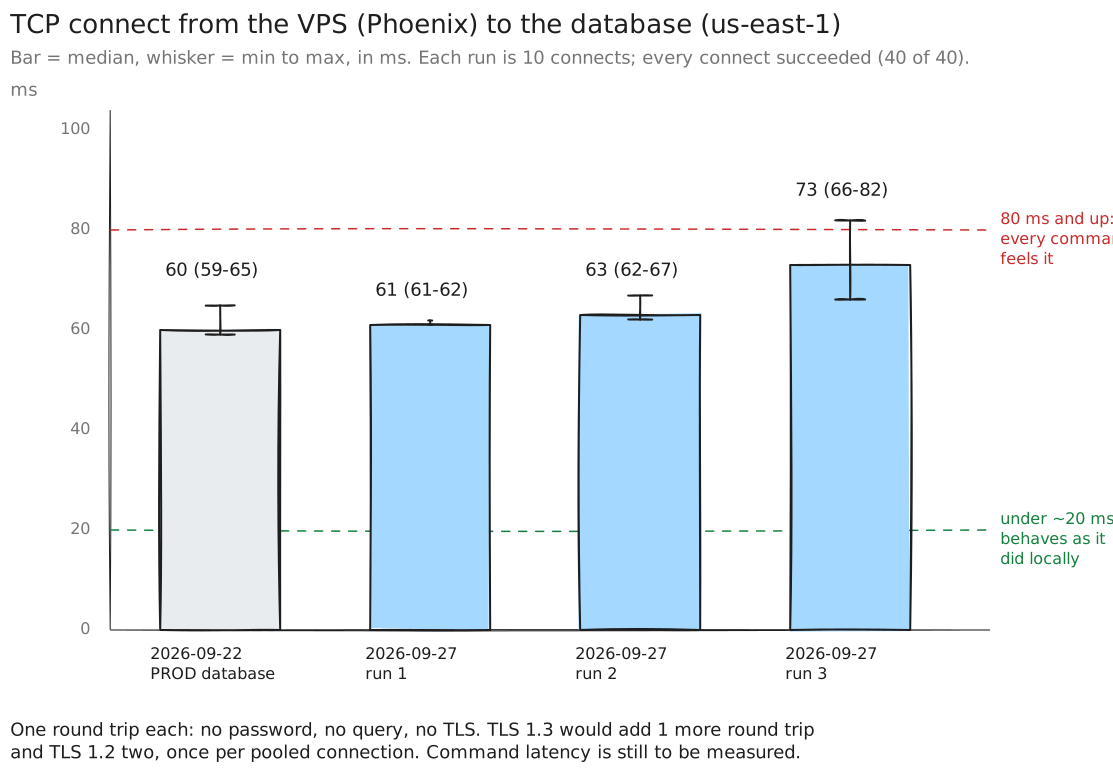
Figure 2. TCP connect time, VPS (Phoenix) to the database (us-east-1), 10 connects per run, 40 of 40 succeeded. 2026-09-22 reading from the operations notes (host not recorded; the production database); 2026-09-27 runs at 03:39Z. Drawn in Excalidraw.
| Run (UTC) | Succeeded | Min | Median | Max |
|---|---|---|---|---|
| 2026-09-22 | 10 of 10 | 59 ms | 60 ms | 65 ms |
| 2026-09-27 03:39Z, run 1 | 10 of 10 | 61 ms | 61 ms | 62 ms |
| 2026-09-27 03:39Z, run 2 | 10 of 10 | 62 ms | 63 ms | 67 ms |
| 2026-09-27 03:39Z, run 3 | 10 of 10 | 66 ms | 73 ms | 82 ms |
The probe prints its own guide. Under about 20 ms the service behaves as it did locally. At 80 ms and up, every command feels it. We are between the two, and closer to the second.
What a TCP number tells you. A TCP connect is one round trip: a SYN out, a SYN-ACK back. So it is the floor for anything the service does with the database. Nothing can be faster than one trip to Virginia and back.
What it does not tell you. It says nothing about a query, and our probe measured TCP only, not TLS. A full TLS 1.3 handshake adds one more round trip, and TLS 1.2 adds two, once per pooled connection, not per query. Each command still makes several database round trips, and commands in one room run one at a time. So the latency a player feels is some multiple of 61 to 73 ms, plus the query time, plus queueing. We have not measured it. That application-level number is a prerequisite for any production switch.
Observability, as built
Grafana Cloud is our backend. We decided not to add OpenTelemetry to the web app on Vercel, because it adds cost there. Observability lives with the VPS services instead.
Two kinds of signal matter here. Logs are events with detail: this room opened, this socket closed. Metrics are numbers sampled over time: how many sessions are open right now. Loki stores logs. Prometheus stores metrics.
The near-miss
When I went to add metrics, there was already an Alloy on the box: hearso-alloy, Grafana Alloy v1.10.0, up for two days. Its config was three blocks: discover Docker containers, read their logs, write to Loki. It shipped logs only, no metrics.
Our kit's first draft would have broken it in two ways:
- It copied our metrics config to the same path the log shipper reads. The deploy would have overwritten the log shipper's config.
- Its rollback removed "the container whose Compose service label is
alloy". The log shipper carries that label too, so undoing our change could have deleted the log shipper.
Both came from the same mistake: we named things as if the box were ours alone. The fix was to rename everything we own. The service became alloy-metrics, with its own config directory and volume, and every container filter now also matches our Compose project. A rollback can only reach what we deployed.
The checks before deploying
Before changing anything, I checked four things:
- Scope of
--remove-orphans. It could only reach hearso-rt and Valkey. The Kafka relay, the log shipper and n8n are separate Compose projects. - No restart of hearso-rt. Its section of the Compose file was byte-identical to the server's copy, so Compose would not recreate it and no socket would drop.
- Nothing overwritten. The credentials file for Grafana Cloud did not exist yet on the server.
- A way back. The server's kit files were backed up first, and every copied file's checksum matched the local copy.
We then redeployed the same hearso-rt build, 700ae6c5. Compose created one container, hearso-alloy-metrics-1, and hearso-rt stayed the same container, up for 3 days.
What "up = 1" means
Prometheus records a metric called up for every target it scrapes: 1 if the scrape worked, 0 if it did not. It is the first thing to check, because every other series depends on it.
The metrics collector logged its first line at 02:31:25Z. Grafana Cloud answered up{service="hearso-rt",environment="production"} = 1 at 02:32:36Z, 71 seconds later. Alloy logged no errors.
Why production shows 0 sessions
Grafana then held six hearso-rt series, and hearso_rt_active_sessions read 0. A production round was played at 02:51Z, and the number stayed at 0.
That zero is correct. Production rooms are still polled, so their traffic goes browser to Vercel to Supabase and never touches the VPS. A zero on a dashboard needs a reason written next to it. Ours is "no production room uses this path yet".
The running build exposes one gauge. The latency histograms added in hearso-rt PR #14 arrive with the next build.
Limitations, today
- One box. A single VPS cannot be load-balanced. If it goes down, both real-time services go down with it.
- Admin access needs a person. SSH to the box goes through Tailscale in
checkmode: each session needs a browser sign-in. An automated agent cannot complete that. Setting the rule toacceptfor a non-root deploy user, or givingchecka period, would change that. - hearso-rt logs only to a file. It writes JSON lines to a file inside its container, and
docker logsis empty. So the log shipper collects nothing from it. The lines also carry no timestamp and no room code. - Room codes belong in logs, not in metric labels. Every distinct label value creates a new time series. Every room has a new code, so as a label they grow without limit, and every active series counts against our Grafana Cloud usage. Counts like "rooms open" are metrics. "What happened in room X" is a log search.
The plan, not built
The next observability steps come after the current release:
- hearso-rt writes structured room events to stdout: room code, game, player count, and no player identity. The existing log shipper picks them up.
- Aggregate room metrics, and a scrape of the Kafka relay. Room codes never become metric labels.
- A "Live rooms" dashboard with a room-code lookup, plus alerts.
After those comes Step 4: moving production rooms onto WebSockets in a way we can control and undo. Everything in this section is PLANNED, NOT BUILT.
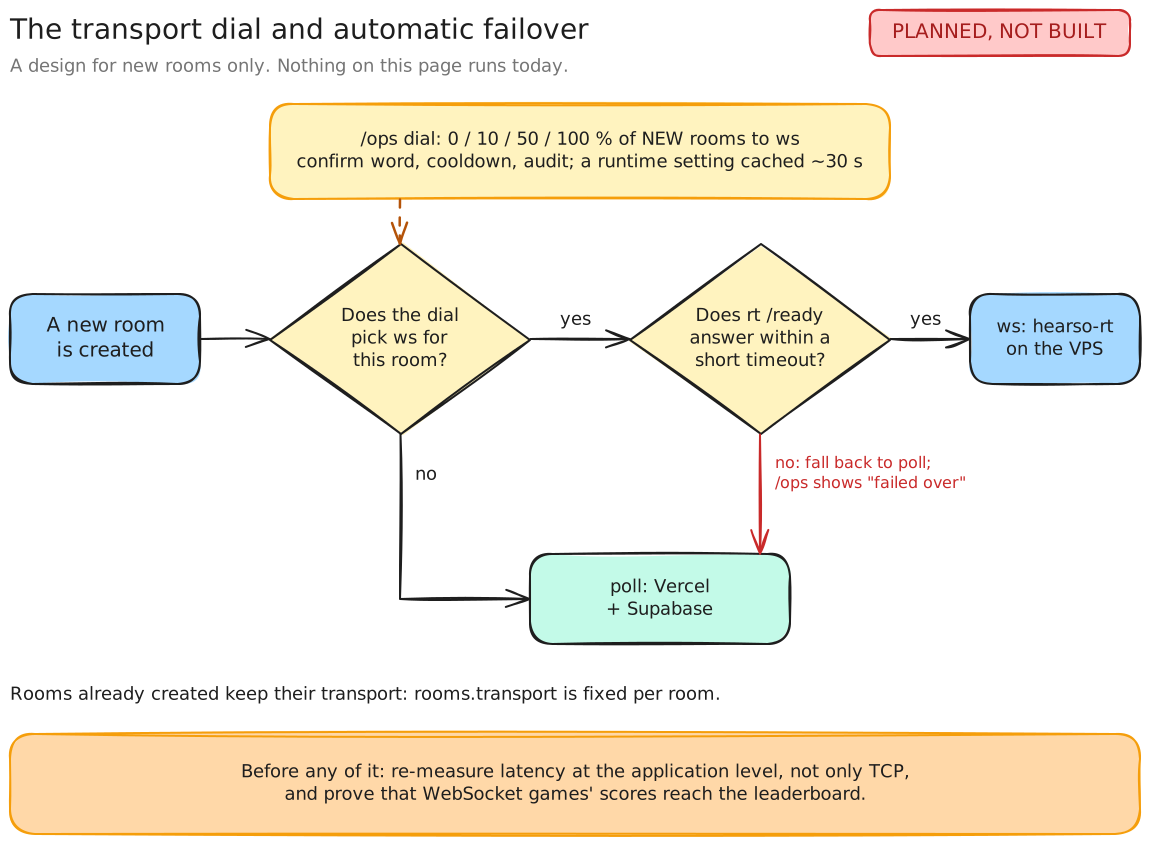
Figure 3. The planned transport dial and automatic failover (4a and 4b below). Nothing in this figure runs today. Drawn in Excalidraw.
Prerequisites. Measure command latency against the remote database, not only TCP. Prove that a WebSocket game's scores reach the leaderboard.
| Part | What it does | Why |
|---|---|---|
| 4a. Transport dial | A setting in our /ops page sends 0, 10, 50 or 100% of new rooms to WebSockets. It needs a confirm word, a cooldown and an audit entry, and servers cache it for about 30 s. | A switch we can turn without a deploy. Rooms already created keep their transport, because each room's transport is fixed when it is created. |
| 4b. Automatic failover | Room creation checks hearso-rt's /ready with a short timeout. No answer means the room polls, and /ops shows "failed over". | If the VPS is down, new rooms poll. That costs more on Vercel, and the games still run. |
| 4c. High-traffic mode | Caps on rooms created per minute and on concurrent rooms on hearso-rt, switches to turn off share cards, pop-ups, replay and sound files, and a maintenance banner. | Something to reach for when a spike shows up in Grafana. |
| 4d. Recovery without AWS | Rooms are durable in Supabase. The outbox holds events while the relay is down, and they drain later. The VPS is rebuilt from the kit. | Neither service is moving to AWS, so recovery has to work from what we have. |
| 4e. A second VPS | Rooms split across two boxes by room code. | Only if traffic demands it. |
4d has a known gap. A WebSocket room that is mid-game when the VPS dies is stranded until the poll path can adopt it, and nothing adopts it today. We will investigate that, then rehearse the whole recovery as a drill on DEV before trusting it.
Key takeaways
- Read the box before deploying to it. Twice, a kit written for an empty machine would have hit something already running: Traefik on 443, then a log shipper's config.
- Name and scope what you own. A rollback filtered on a generic label can delete someone else's container. Filter on your own project as well.
- A health check does not see latency.
/healthwas green while more than half of one run's commands went unanswered. - A timeout is not a server error. Our client counted "no reply in 10 s" as a 5xx, and it sent us looking in the wrong place.
- A TCP number is a floor, not a verdict. 61 to 73 ms tells us the minimum a query can cost, not what a player will feel.
- A dashboard zero needs a reason. 0 sessions is right while production polls. It would be alarming a week after the switch.
- Keep the switch one setting. The nine-minute production flip was easy to undo because only one value changed.
What I'd do next
- Measure command latency from the VPS against the remote database, with the same A/B method as 2026-09-23, on the build with PR #11 in it.
- Prove a WebSocket game's scores reach the leaderboard.
- Ship the next hearso-rt build, so the histograms from PR #14 reach Grafana.
- Build observability steps 1 to 3, then 4a and 4b, in that order.
- Run the recovery drill on DEV, including a room that is mid-game when the service stops.
Evidence
All times UTC.
- The box and its neighbours (Figure 1, first table): container list and system readings on the VPS, 2026-09-27; operations notes, 2026-09-22 (Traefik owning 80 and 443, the kit written for an empty box, the router added to the existing Traefik). Load average 0.07, 7,940 MiB total, 6,716 MiB available, and the Phoenix location: the latency run's output at 03:39:01Z.
- The 1,500 ms poll and 40 requests a minute:
POLL_MSinapp/room/[roomId]/room-client.tsx; 60,000 / 1,500 = 40. - The production flip and revert: operations notes, 2026-09-23. Flip at about 01:45Z, a production room stamped
ws, a 101 upgrade and the actor start logged on the VPS; revert at about 01:54Z because WebSocket games' scores reached no leaderboard. - The remote-database A/B (second table): operations notes, 2026-09-23. Same binary and bots;
room.answerp50 3,658 ms (one run 10,255 ms) against 7 ms, max 20,572 ms against 21 ms, 22 of 41 unanswered within 10 s against 0; 2,511 transactions for one game; 2,702 ms p50 after the partial fix. - The polling loop removed: hearso-ws-game-service PR #11, commit
ad2624f. No command-latency measurement against a remote database since. - TCP connect times (Figure 2, third table):
measure-db-latency.shon the VPS, 2026-09-27 from 03:38:59Z, three runs of ten, each 10 of 10: min/median/max 61/61/62, 62/63/67 and 66/73/82 ms. The 2026-09-22 reading, 10 of 10 with min 59, median 60, max 65: operations notes, 2026-09-22. The 20 ms and 80 ms guide lines are the script's own text. The script's comment also said a TLS session adds two or three more round trips; that overstated it, and the post and Figure 2 give the corrected cost (one more round trip for TLS 1.3, two for TLS 1.2). - The existing log shipper and the near-miss: overnight handoff, entries 21:10 and 21:15 CDT on 2026-09-26; the deploy kit README's metrics section; the kit's earlier draft, kept as a backup, which wrote the log shipper's config path and filtered its rollback on the service label
alloy. - The pre-deploy checks, the deploy and
up= 1: overnight handoff, entry 21:32 CDT (02:32Z). Metrics collector's first log line at 02:31:25Z;up= 1 at 02:32:36Z; no Alloy errors; build700ae6c5; hearso-rt container unchanged, up 3 days. - Six series, 0 active sessions, one gauge, the round at 02:51Z played with polling: overnight handoff, entry 21:55 CDT.
- hearso-rt logs only to a file: operations notes, 2026-09-22.
- The plan (Figure 3, fourth table): overnight handoff, entries 22:10 and 22:15 CDT on 2026-09-26, and the operations note recording the Step 4 direction.
No credential, token, address of an internal service or player identity appears in this post or its figures.