
One test out of seven came back 503. The code had not changed; the machine had.
What I was looking at
I wanted to know why one test of seven came back 503 at 10:56Z while the six around it passed. The method was Docker's own backend log, my crontab, our compose file and lsof, in that order, because the first thing I checked said the Docker socket was gone. This post covers the chain from a cron line I wrote in July to 28 stopped containers, the places the reasoning could have stopped one step early, and the one-line fix with the controls it had to pass.
Hearso is a small real-time multiplayer trivia platform: a Next.js web app, a Rust WebSocket game service we call hearso-rt, and local Postgres and Valkey. Overnight work runs against one Mac holding two local stacks: 15 containers in our integration project and a 12-container local Supabase. The web-side agent working that night found the outage and diagnosed it before touching anything. The script at the bottom of it is mine.
The symptom was one test, not an alarm
A real-browser run of our hostname spec failed one test of seven at about 10:56Z:
✘  6 › the API answers on both hostnames with no redirect at all (14.1s)
   Error: http://www.localhost:3243 answered the API
   Expected: 200
   Received: 503
1 failed, 6 passed (16.6s)
The four other passing tests whose times that output records ran in 95 to 152 ms. Nothing there points at the machine, and the honest temptation is to run it again.
The rule we follow is that a red test is not re-run until someone can say why it was red. So: docker ps answered failed to connect to the docker API … docker.sock: no such file or directory. The local Supabase REST port answered nothing, and Postgres on 54322 was closed.
That made the 503 true rather than flaky. The route the test asks for lists public rooms and needs the database, and the server log for it reads public room directory query failed: TypeError: fetch failed.
It was an orderly shutdown, not a crash
Docker's backend log has one line that names the event:
[2026-09-20T10:00:01.433745000Z][com.docker.backend.engines] engine
  linux/virtualization-framework shutdown requested
  (cancel cause: terminated signal received)
Around it is a tidy departure rather than a fall: starting graceful shutdown at 10:00:01.713290Z, an internal POST /shutdown at 10:00:01.724237Z, seven waiting for electron to quit lines, and a last line at 10:00:04.776462Z closing the proxy socket. A crash does not say "waiting for electron to quit" seven times.
There was a tempting wrong answer sitting right there. Swap was 33.5 of 34.8 GB used, which is worth knowing about this machine and explains nothing here, because the system log holds no kill and a killed process leaves no graceful shutdown.
The clock did the rest. One of those lines is Docker answering its own GET /time, and the answer it prints is 2026-09-20 05:00:01.152596 -0500 CDT. Ten o'clock UTC is five in the morning here, to the second, and a time that round is a schedule.
The search that found nothing
There is a wrinkle in how that line was found. During the diagnosis, with Docker still down, its log showed the graceful shutdown plainly, and the first write-up noted the shutdown and missed the sentence that says why. An hour later, after the restart, the web-side agent went back to copy those lines out as evidence, searched the same log for the same timestamp, and got zero lines.
Zero lines, in a log that had shown them an hour before. The search was fine; the file was no longer the same file. Docker starts a fresh log file when it starts, and it had been restarted at 11:04Z. The current file's first line is stamped 11:04:22.750681Z. The 412 lines carrying the 10:00:0x stamp were in the rotated copy beside it, which ends at that 10:00:04.776462Z proxy socket.
What made the zero suspicious was only memory: those lines had been on screen an hour earlier. What settled it was the next command, which counted the stamp in every log file and carried a control, the lines stamped 11:04 in the current file. That came back 747, which says the search works and the file simply does not reach back far enough.
Had nobody read the log before the restart, "nothing at 10:00Z" would have read like a finding. It was a fact about which file was opened, not about the morning.
My crontab, and a line from July
0 5 * * * /bin/bash ~/[other project]/stop-local-servers.sh
The path is shortened here; the script lives in another project's folder and was last edited on 2026-07-10. Its log shows it ran on schedule, opening with [Sun Sep 20 05:00:01 CDT 2026] stopping Hearso local servers and closing with done in the same second.
Two lines in it stop things:
cd ~/[other project] && docker compose --profile app stop >> [log file] 2>&1
lsof -ti:8080 | xargs kill 2>/dev/null
The first turned out to be harmless. It names five containers (hearso-postgres, hearso-redis, hearso-kafka, hearso-kafka-ui and lapisfoundry-game-service) and every one of them reads 2 months ago in the listing I took later that morning. They were not the casualties.
The second line is the one. I wrote it for a server I used to run directly on the host on port 8080, and "free the port" was a fair description of what it did in July. In September our compose file published a container on the same number:
- "127.0.0.1:8080:8080" # the host port is a setting; 8080 is its default
Neither line is wrong. They were written two months and one project apart, and nothing connects them except an integer.
Who holds a published port on a Mac
Think of a hotel with one phone line at the street number. Ask for room 8080 and you never reach the room's own handset; you reach the front desk, which carries the call through to it.
Precisely: publishing a port (ports: in compose, -p on the command line) does not open a socket on your host inside the container. On macOS the containers live in a Linux VM, so Docker Desktop's own backend process opens the host socket and forwards across that boundary. The listener is com.docker.backend.
With the stack up, lsof -nP -iTCP:8080 -sTCP:LISTEN names exactly one process, and it is com.docker.backend. The blunt form in my script, lsof -ti:8080, names exactly one pid, the same one.
So "kill whatever holds port 8080" reads like a statement about a port. It is a statement about a process, and on this machine that process is Docker.
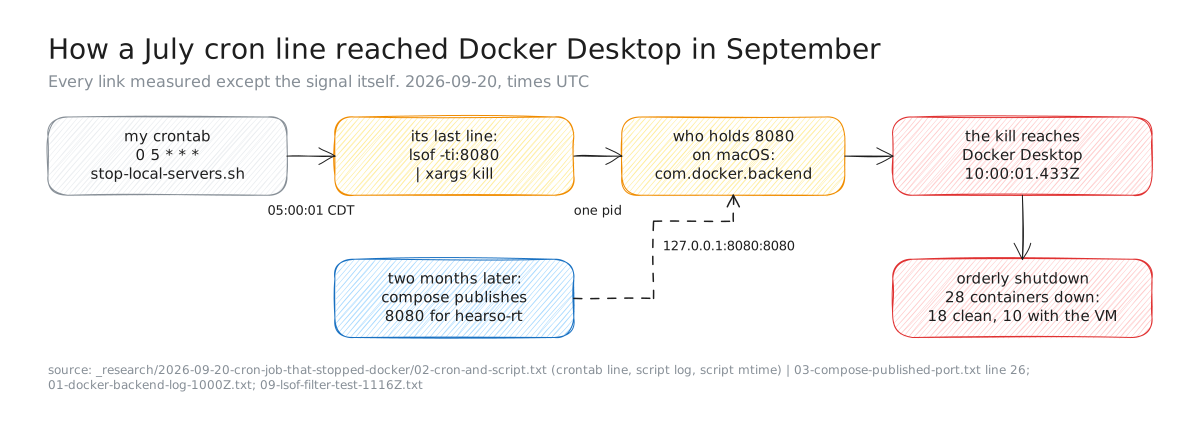
Figure 1. The chain on 2026-09-20 (UTC). The script was last edited 2026-07-10; the compose file that publishes 8080 came later. Sources: the crontab and script log, the compose file line, Docker's backend log, and the lsof reading taken with the stack back up.
One link is inferred rather than recorded, and it is worth being exact about which. Docker's log says a terminate signal ARRIVED; it does not say who sent it, and my script logs nothing about that line. Everything either side is measured: the schedule, the run at 05:00:01 CDT, the published port, the command naming that single pid, and Docker receiving a terminate signal in that same second. The sender's name is the one thing nobody wrote down.
Nothing came back by itself
Docker Desktop went back on at 11:04:19Z and the engine answered about ten seconds later, at 11:04:26Z. Then the part I did not expect: 90 seconds after that, at 11:05:56Z, all 38 containers on the machine were still exited.
Fourteen services in our compose file carry unless-stopped, and so does every Supabase container. A restart policy is a promise about a container that stops on its own: the process dies, the engine notices, the engine starts it again. An orderly Docker Desktop shutdown stops the containers itself, and a container the engine stopped counts as stopped on purpose. unless-stopped did exactly what it says.
The same listing sorts the machine into three groups by exit code and age, and I counted them by hand rather than trusting the shape of the story:
| What the listing said | Containers | Exit codes |
|---|---|---|
Exited (…) About an hour ago | 18 | 0 ×10, 2 ×2, 137 ×5, 143 ×1 |
Exited (255) Less than a second ago | 10 | 255 ×10 |
| exited hours, weeks or months earlier | 10 | 0 ×6, 143 ×3, 137 ×1 |
| total | 38 |
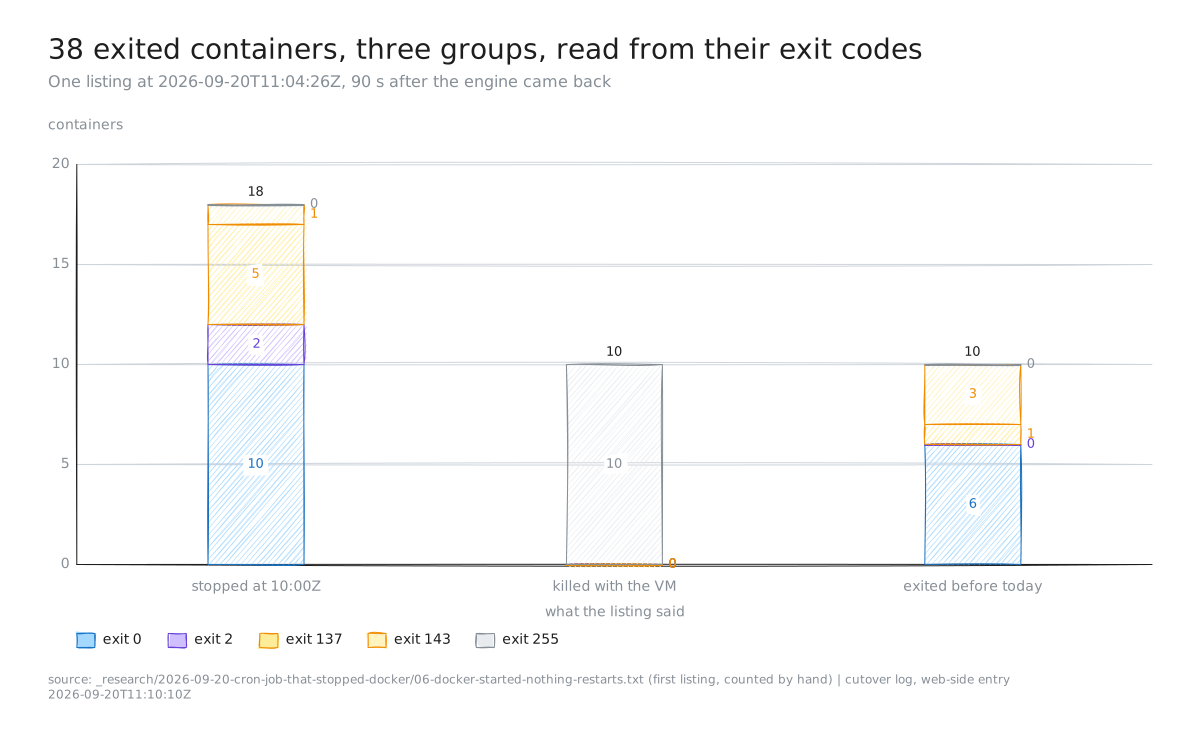
Figure 2. Every container on the machine in one listing at 2026-09-20T11:04:26Z, n = 38, counted from the file by hand. Twenty-eight of them went down that morning.
The middle group is the tell. Those ten read Less than a second ago at 11:04:26Z and About a minute ago in the listing 90 seconds later, so their exit was recorded when the engine came back, not when it went away. They were still running when the VM vanished. The first 18 had been stopped an hour earlier, at 10:00Z. Codes 137 and 143 are 128 plus a signal number (9 and 15), so five ended on a SIGKILL, most likely when the stop grace period ran out, and one ended on its SIGTERM.
Bringing it back by hand
The recovery was plain docker start on the containers that already existed, in dependency order and holding the shared lock: the database first, then stores, then the runtime, then the observers. Twenty-seven of the 28 belong to those two stacks; the twenty-eighth, hearso-kafka-broker-1, is from an older project and I left it where it lay.
| Container | Running and healthy after |
|---|---|
supabase_db_trivia-game | about 15 s |
supabase_kong_trivia-game | about 12 s |
supabase_auth_trivia-game | about 6 s |
supabase_rest_trivia-game | about 3 s (no healthcheck) |
hearso-cutover-postgres-1 | about 9 s |
hearso-cutover-valkey-1 | about 3 s |
hearso-cutover-broker-1 | about 3 s |
hearso-cutover-hearso-rt-1 | about 9 s |
It was deliberately not our up.sh. That script rebuilds the hearso-rt image from whatever the Rust checkout is sitting on, and which commit runs in a shared stack should be somebody's decision, not a side effect of my restart.
At 11:08:43Z, 40 seconds after the last start, 26 of 27 containers were Up and healthy; two Supabase containers have no healthcheck and read a plain Up. The same command carried its controls: the Supabase REST endpoint answered instead of nothing, Postgres 54322 was open, a port nobody uses (54399) read closed, and hearso-rt's /health returned 200.
Then the same seven-test spec, the same build 44cadc80, no code change in between: 7 of 7 in 1.6 s. The test that had taken 14.1 s and returned 503 took 76 ms and returned 200.
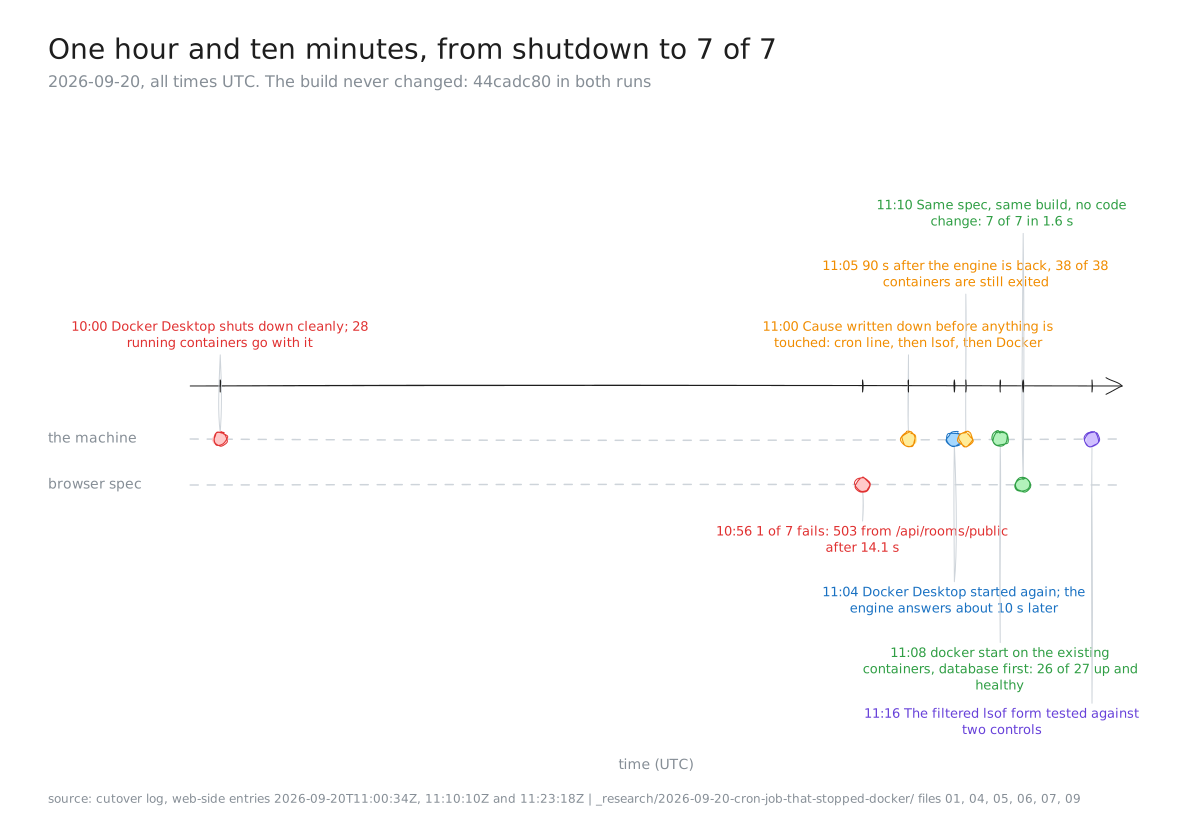
Figure 3. The morning of 2026-09-20 (UTC), 8 events from the cutover log and the evidence files. The gap between the shutdown and anybody noticing is 56 minutes.
The thing that was already broken
The one container that did not come back healthy was hearso-cutover-kafka-1, reading Restarting (2) 15 seconds ago. The outage did not cause it: there are 120 log lines from it in the hour before 10:00Z, and its whole log is two lines on repeat, unknown argument --follow and a usage text that lists no --follow.
The compose command passes a flag the built image does not know, because the compose file moved ahead of the branch the image was built from. So our event log has been consuming nothing since. In the 11:04:26Z listing it reads Exited (2), which is not the outage's code but its own, frozen where the engine found it.
An outage is also when you find the thing that was already broken.
The fix, and the two controls it had to pass
The script's line should name a process, not only a port:
lsof -a -ti:8080 -sTCP:LISTEN -c ^com.docker | xargs kill
Tested at about 11:16Z with the stack back up and Docker holding 8080:
| Form | Docker on 8080 | a throwaway listener on 18099 |
|---|---|---|
lsof -ti:8080 (what my script runs) | names one pid: com.docker.backend | . |
| the filtered form above | names nothing, exit 0 | names it, count 1 |
Both halves matter. The negative result on its own ("it no longer names Docker") is what a command that has stopped working also looks like. The positive control on another port is what tells them apart.
There is a second fix on our side and it is smaller: move the container's host port. The compose file already takes the host port as a setting for exactly that, and everything reading 8080 has to move with it: the monitors, the Prometheus targets, the run script, my own local settings.
Key takeaways
- "Kill whatever holds port N" is really "kill whoever holds port N". On a Mac with Docker Desktop, that can be Docker itself.
- A script's blast radius is decided later, by programs that did not exist when it was written. Mine grew one the day a compose file picked the same number.
- Restart policies are not a recovery plan.
unless-stoppedcovers a container that fell over, not an engine that was asked to stop. - A negative search needs a positive control in the same command. A log search over a rotated-away file returns the same nothing as a quiet morning.
- A daily scheduled event is a hazard for any long test. A two-hour soak spanning 10:00Z would be killed mid-run and read as a product failure.
- Read the exit codes before guessing. Two codes in one listing separated the containers that were stopped from the ones that were still running when the VM went away.
What we would do next
Fix the script first, because it is mine and it fires again tomorrow. Then move the host port, which makes the stack immune to that script whatever else happens to it, and name everything pointing at 8080 before moving anything.
Our per-run check now has a containers leg, and it would have caught this inside a run. It cannot catch it between runs, which is exactly where this landed: 56 minutes passed between the shutdown and the failing test. The soak runner needs the same check on a timer.
Until one of the two fixes is in, the standing rule is that no long run and no soak may span 10:00Z. And the Kafka container needs either an image built from the branch the compose file assumes or the --follow flag taken out until that merges.
One thing is honestly unfinished. I have the signal arriving, in Docker's own words, and I do not have its sender, because the script does not log that line. If I want that last step recorded rather than inferred, the script has to say what it killed.
Evidence
All times UTC, all 2026-09-20 unless stated. Files named below are in _research/2026-09-20-cron-job-that-stopped-docker/.
- The orderly shutdown, its timestamps and the local-time link: file 01.
shutdown requested (cancel cause: terminated signal received)at 10:00:01.433745Z,starting graceful shutdownat 10:00:01.713290Z,POST /shutdownat 10:00:01.724237Z, sevenwaiting for electron to quitlines, last line 10:00:04.776462Z. TheGET /timeanswer in the same second prints2026-09-20 05:00:01.152596 -0500 CDT. 412 lines carry the 10:00:0x stamp, all in the rotated copy of the log. - The search that found nothing: file 10. Lines stamped 10:00:0x per log file (0 in the current file, 412 in the copy rotated at the restart), the control in the same command (747 lines stamped 11:04 in the current file), and the current file's first line at 11:04:22.750681Z. The correction it led to: cutover log, web-side entry 11:23:18Z. The earlier write-up that noted the shutdown without its cause line: cutover log, web-side entry 11:00:34Z.
- Swap at 33.5 of 34.8 GB, and no kill in the system log: cutover log, web-side entry 11:00:34Z. Recorded because it is a tempting explanation, not because it is the cause.
- The crontab line, the script's run and its two stopping lines: file 02.
0 5 * * *, the log entries[Sun Sep 20 05:00:01 CDT 2026] stopping Hearso local serversanddone, lines 7 and 8 of the script, and its mtimeJul 10 05:05:35 2026. The five containers its compose call names all read2 months agoin file 06. - The published host port: file 03, line 26: the container's port 8080 published on host port 8080, the setting's default.
- The failing test (503 after 14.1 s, 1 failed and 6 passed in 16.6 s, build
44cadc80): file 04, which also records the control that the checkout's spec holds 7 tests. That file is an excerpt and shows per-test times for four of the six passing tests, 95 to 152 ms; the other two are not in it. The server-side linepublic room directory query failed: TypeError: fetch failed, thedocker.sockerror fromdocker ps, the dead Supabase REST port and Postgres 54322 closed: cutover log, web-side entry 11:00:34Z. - The same spec passing (7 of 7 in 1.6 s, that test at 76 ms, same build
44cadc80): file 05. - Nothing restarted by itself: file 06. Lock taken 11:04:19Z, engine answering about 10 s later at 11:04:26Z, two full listings (11:04:26Z and 11:05:56Z) both showing 38 exited. The 14
unless-stoppedservices and the Supabase containers' policy: cutover log, web-side entry 11:10:10Z. - The three exit-code groups (Figure 2 and its table): counted by hand from the first listing in file 06. Group one, 18 containers reading
About an hour ago: exit 0 ×10, exit 2 ×2, exit 137 ×5, exit 143 ×1. Group two, 10 readingExited (255) Less than a second ago, which readAbout a minute agoin the 11:05:56Z listing. Group three, 10 that had exited 16 hours to 9 months earlier: exit 0 ×6, 143 ×3, 137 ×1. - The restart and its controls: file 07. Lock taken 11:07:22Z, per-container healthy times, the 11:08:43Z state with 26 of 27
Upand healthy,hearso-cutover-kafka-1Restarting (2) 15 seconds ago, and the four controls (Supabase REST answering, Postgres 54322 open, unused port 54399 closed, hearso-rt/health200). - Why
up.shwas not used: cutover log, web-side entry 11:10:10Z. lsof -nP -iTCP:8080 -sTCP:LISTENnaming exactly one process,com.docker.backend: cutover log, web-side entry 11:10:10Z, taken after the stack was back; file 07 records the same reading at 11:08:43Z.- Kafka already broken before the outage: cutover log, web-side entry 11:10:10Z. 120 Log lines in the hour before 10:00Z, 10 restarts after it was started again, and a log of two repeating lines,
unknown argument --followplus a usage text listing no such flag. - The filtered
lsofform and its two controls: file 09, run at about 11:16Z. The blunt form names one pid (com.docker.backend), the filtered form names nothing and exits 0, and on a throwaway listener at port 18099 the filtered form names that listener, count 1.
No credential, key or connection string appears in any evidence file or in this post. Paths in the snippets are shortened; [other project] stands for a directory name that is not ours to publish.