
I wanted one number: how long after a player submits a score can anyone actually see it on the board. Getting a number I trusted took two runs, because the first one could not be repeated.
What I was measuring, and with what
Hearso's leaderboard is a small AWS service: API Gateway, a few Lambdas, and a DynamoDB table whose secondary index holds the ranked order. I used the repository's own propagation runner (npm run benchmark:propagation) against the DEV stack in us-east-1, with response caching switched off. Each sample starts the clock immediately before POST /scores and stops it when that player appears in GET /leaderboards.
Think of the main table as a filing cabinet sorted by player, and of a second cabinet a clerk keeps sorted by score. That second one is a global secondary index, and DynamoDB refreshes it in the background rather than as part of your write. So a write that already returned 200 and a score that is readable in rank order are two different moments, and the gap between them is what this measures.
Percentiles, and the promise attached to them
Line every sample up slowest-last. The p95 is the value 95 percent of them came in under; p50 is the middle sample and p99 is near the worst. In the accepted run p50 was 159 ms and p99 was 322 ms (double) so an average would have quietly hidden the part players notice.
A service level objective is a promise with both a number and a percentile in it. Ours: a submitted score is readable through the regional API within one second at p95. We measured 210 ms, leaving 790 ms of headroom, the slack between promise and measurement, which is what tells me whether the next feature on this path is affordable.
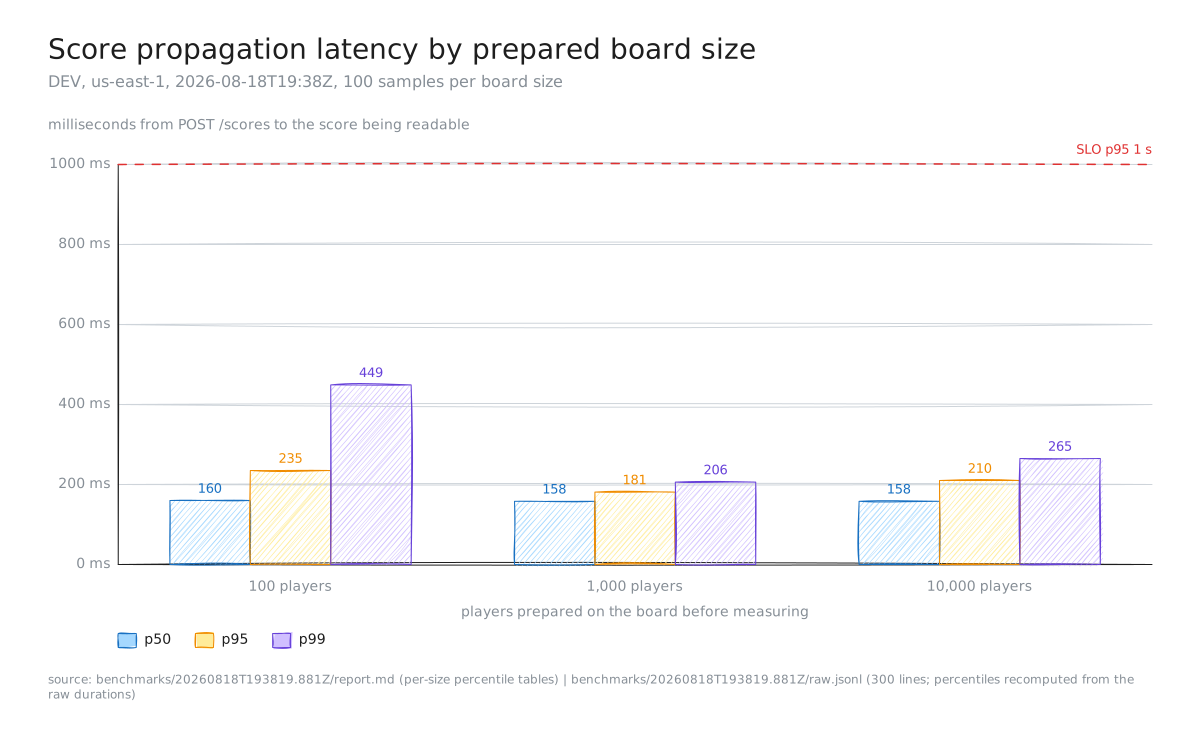
Figure 1. Propagation percentiles per prepared board size, 100 samples each (300 total), DEV us-east-1, run started 2026-08-18T19:38:19Z. Source: benchmarks/20260818T193819.881Z/.
The run I threw away
The first run finished at 09:41Z with 300 samples, p95 239 ms, zero errors. It passed. Then I worked out how to repeat it, and realised I couldn't.
A benchmark is a chemistry experiment, and the first rule is that the beaker starts clean. Isolation here means every replay begins from the same state. The run seeds a board to a given size, then submits 100 deterministic measurement players and times each one's appearance, and those 100 probes stay on the board afterwards, while the board's name was fixed: propagation-slo-v2-{leaderboardSize}, the same every time.
So the "100-player" board would greet the next replay with 200 rows. The measurements were true for that one moment and useless as a baseline, so I rejected the run.
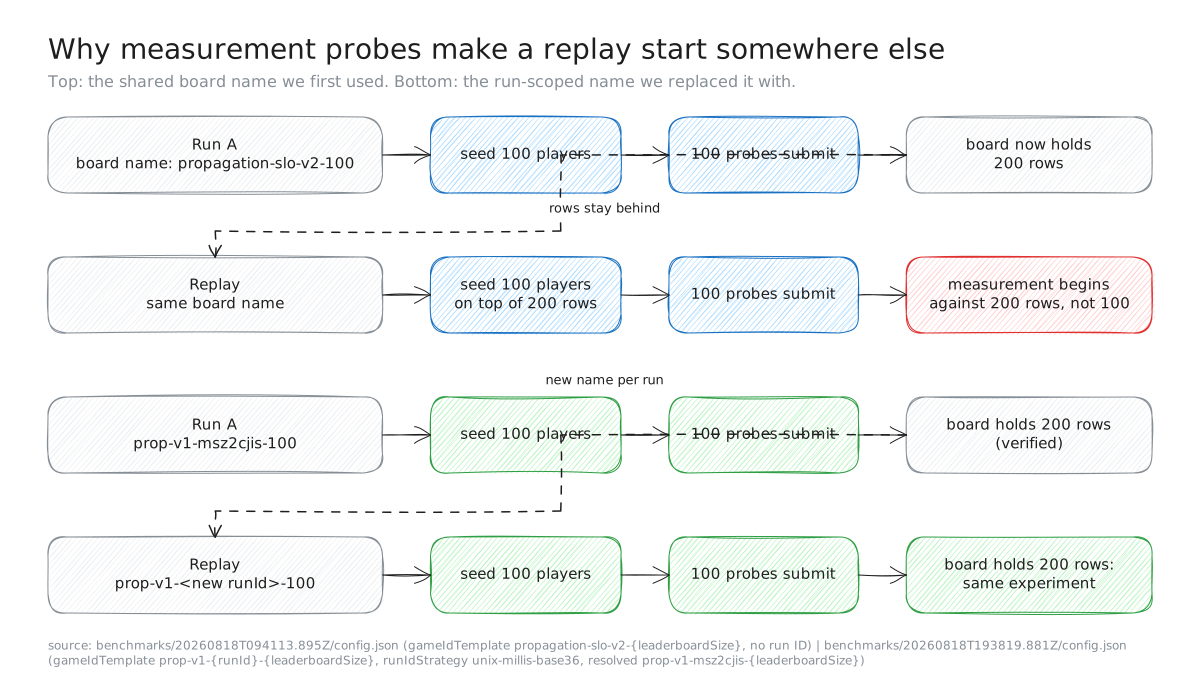
Figure 2. The reproducibility flaw and its fix. Board names are the game-ID templates recorded in each run's config.json.
The fix was one line of configuration
The corrected harness makes the namespace part of the experiment instead of part of the cleanup. A run-scoped namespace is a board name with the run's identity baked in, so two runs can never touch the same rows:
prop-v1-{runId}-{leaderboardSize}
{runId} becomes a base-36 encoding of the Unix time in milliseconds when the run starts, and the committed config records the strategy, the generated ID and the template it resolved to: here prop-v1-msz2cjis-{leaderboardSize}. A cleanup instruction in a runbook is a wish; a namespace rule in the executable config is a fact.
What the accepted run says
| Players prepared | p50 | p95 | p99 |
|---|---|---|---|
| 100 | 160 ms | 235 ms | 449 ms |
| 1,000 | 158 ms | 181 ms | 206 ms |
| 10,000 | 158 ms | 210 ms | 265 ms |
| All 300 samples | 159 ms | 210 ms | 322 ms |
Zero errors, and all 300 samples resolved on the first poll. Post-run verification found 200, 1,100 and 10,100 rows: each prepared size plus its 100 probes.
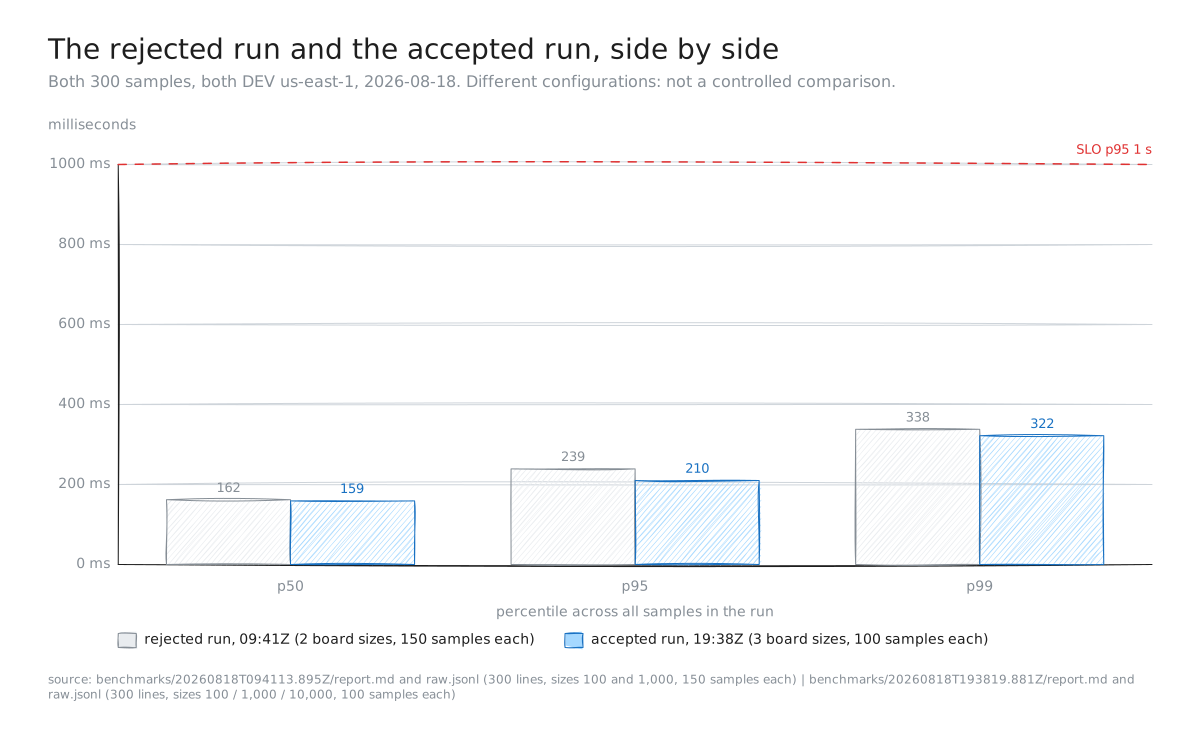
Figure 3. Percentiles of the rejected 09:41Z run and the accepted 19:38Z run, 300 samples each, 2026-08-18. The two runs differ in board sizes, sample counts, seed score range and deployed commit, so the gap between them is not a measured effect of the namespace change.
I would not read "bigger boards are faster" off that table. The sizes ran one after another, each distribution holds only 100 samples, and ordinary variance moves percentiles around. The defensible claim is narrower: going from 100 to 10,000 prepared players produced no evidence of a regression.
The slowest sample in the run was 1,533 ms, and it was sample 1 of the first board. The first end-to-end score this service ever recorded on real AWS took 3,265 ms (Lapis-Foundry-Labs/online-leaderboard#30), so a slow first sample is a pattern here, but a pattern is not a diagnosis, and I never established this one's cause.
The part I still have not fixed
The decision record that sets this SLO still quotes the rejected run. 239 Ms, 761 ms of headroom, pointing at the 09:41Z folder. Correcting it means writing a superseding record, and I haven't. The verdict is the same either way, but the citation sends a future reader to data I decided not to stand behind.
Freshness is a separate promise for a separate seam: six seconds at p95 through the CDN edge, being the one-second propagation budget plus up to five seconds of cache age. Caching is still off, so that number is not measured, and reporting a regional result as an edge result would fold two failure modes into one comfortable figure.
Key takeaways
- A benchmark is only as trustworthy as its namespace. If the system under test keeps data, isolation belongs in the config, not in a runbook step.
- Reproducibility covers every stateful input: population, namespace, cache path, target commit, and the seam you measure at.
- Quote the percentile you promised and say how much headroom is left. Ours: p95 210 ms against a 1 s target, so 790 ms spare.
- Passing is not the same as defensible. Both runs passed; only one can be replayed.
- Fixing a measurement does not fix the documents citing the old one.
What we would do next
- Write the superseding decision record, so the SLO cites the accepted run instead of the rejected one.
- Interleave the board-size order, so a size comparison is not confounded by run order.
- Raise samples per size above 100 before quoting a p99 per size; at 100 samples, p99 rests on a single measurement.
- Measure freshness at the edge once response caching is on, as its own run, never inferred from this one.
Evidence
All times UTC.
- Accepted run, 300 samples, p50 159 / p95 210 / p99 322 ms, 0 errors:
benchmarks/20260818T193819.881Z/report.md; recomputed from the 300 lines ofraw.jsonl, which also showok: trueandpolls: 1on every sample. - Per-size percentiles (160/235/449, 158/181/206, 158/210/265 ms): same report and raw file; each size holds exactly 100 samples.
- Slowest sample 1,533 ms:
raw.jsonl, first line,{"durationMs":1533,"leaderboardSize":100,"sample":1}. - Run configuration and isolation:
benchmarks/20260818T193819.881Z/config.json:gameIdTemplateprop-v1-{runId}-{leaderboardSize},runIdStrategyunix-millis-base36,resolvedGameIdTemplateprop-v1-msz2cjis-{leaderboardSize}, commit7e8a1cd,propagationTargetP95Ms1000. Resolution logic:tools/benchmark-runner/run-propagation.mjs. - Post-run populations 200 / 1,100 / 10,100: reproducible configuration section of the accepted run's
report.md. - Rejected run, p50 162 / p95 239 / p99 338 ms:
benchmarks/20260818T094113.895Z/report.mdand its 300-lineraw.jsonl; itsconfig.jsoncarriesgameIdTemplatepropagation-slo-v2-{leaderboardSize}with no run ID, sizes 100 and 1,000, 150 samples each, seed scores 1 to 1,000, commit6fe0834. - The SLO, its 1-second target, and the stale citation:
docs/adr/0012-propagation-and-freshness-slos.md(LFL26LEADBORD-031), which records 239 ms and "761 ms of observed headroom" and points atbenchmarks/20260818T094113.895Z/. - Freshness is gated, not measured: SLO verdict table in the accepted run's
report.md: "GATED. Caching is disabled". - The two runs as they were reviewed:
Lapis-Foundry-Labs/online-leaderboard#47(the rejected run's measurement) and#49(the baseline, recording the probe-row skew and the namespace fix). The 3,265 ms first live write is#30.