
I wanted a defensible number for what one submitted score costs us to store, before the table shape became impossible to change.
One accepted submission causes 11 item writes and 3 strongly consistent reads in the merged code. Getting to that number, and to a price for it, took an estimate, a correction and one real measurement.
Why this had to be answered first
The service never sorts at read time. Rank is encoded into the key each row is written with, and that key format, along with the index using it, is fixed from the first row onwards. Changing it later means building a second index, moving readers across, then dropping the old one, so the cost had to be known while the design was still cheap to reject.
The table design is a longer story, and a separate post covers the keys, the index and the projection.
Write fan-out, and the unit it is billed in
Posting one letter is cheap. Posting one letter with a carbon copy to three departments, each filing its own copy in a second cabinet, is eight envelopes. Write fan-out is that multiplier: how many stored items one logical action actually touches.
DynamoDB bills those envelopes in write request units. One unit covers writing one item of up to 1 KB; an item twice that size costs two. Our table runs on-demand, so there is no reserved capacity to plan and idle hours cost nothing, which suits a service that bursts when a game ends and then sits quiet.
The second cabinet matters too. The ranked order lives in a global secondary index, and DynamoDB maintains it with its own write every time the base row changes. Every index is another write, billed separately, forever. That is the biggest single reason our fan-out is what it is.
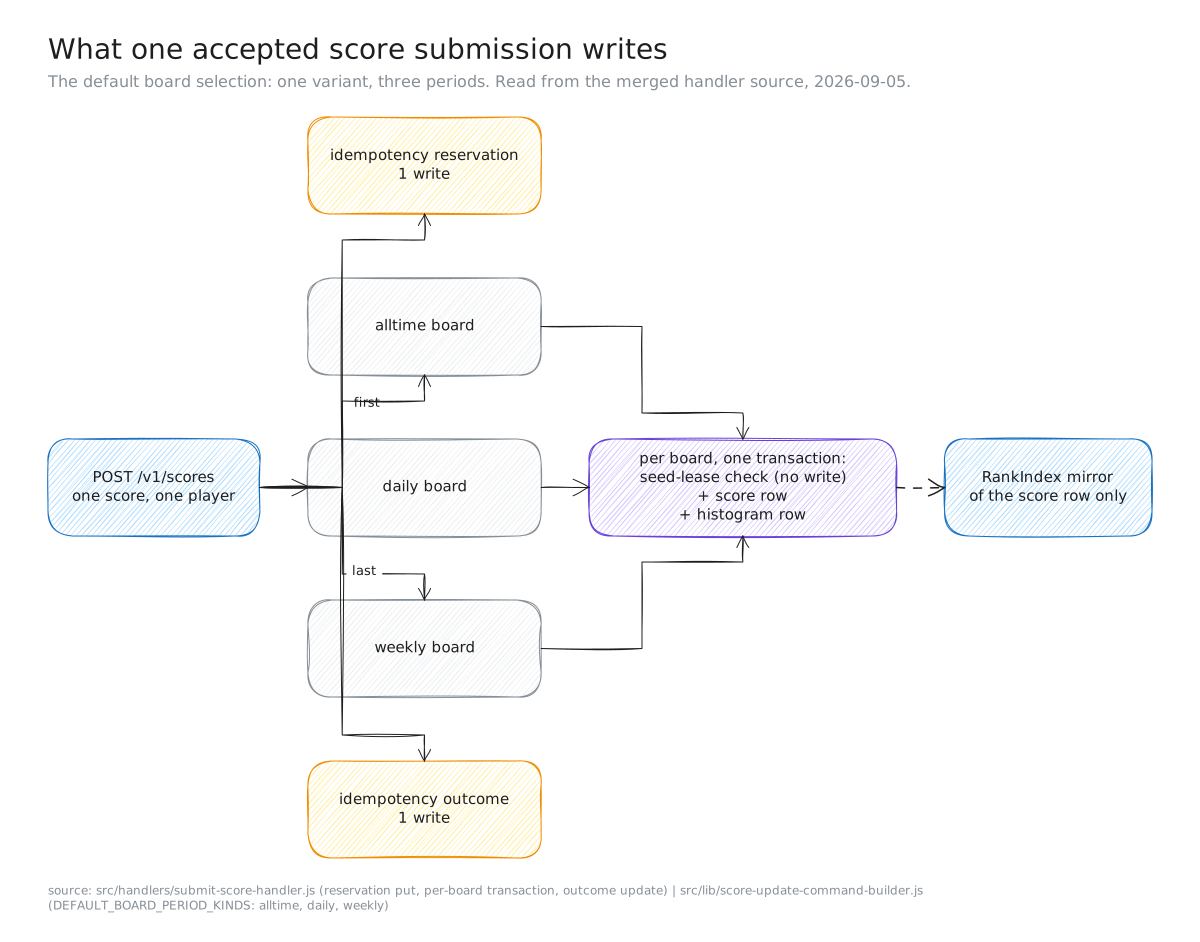
Figure 1. The write fan-out of one new-or-improving submission with the default board selection, counted by reading the merged handler and command-builder source at the merge commit of 2026-09-05.
The arithmetic we recorded, step by step
The original decision record priced the design at roughly $0.68 a month at 1,000 submissions a day. It recorded the result and not the working, so here is the working, reconstructed from its own stated inputs:
- 1,000 submissions/day × 30 days = 30,000 submissions/month.
- Nine conditional writes per submission (three periods × three variants) = 270,000 item writes.
- Each one mirrored into the index = 270,000 more, so 540,000 write request units.
- 540,000 ÷ 1,000,000 × $1.25 = $0.675, which rounds to the $0.68 in the record.
Every assumption that arithmetic rests on:
| Assumption | Value | Where it comes from |
|---|---|---|
| Region | us-east-1 | the operating constraints in our requirements doc |
| Billing mode | on-demand (PAY_PER_REQUEST) | the table design record |
| Item size | under 1 KB, so one unit per write | not recorded anywhere; assumed |
| Index writes | one index write per score write | one index, RankIndex, per the table design record |
| Month | 30 days | implied by "per month"; not stated |
| Improvement rate | every submission improves on every board | not stated; the worst case |
| Unit price | $1.25 per million write request units | not recorded anywhere in the repository |
That last row is the one to be careful with. No price list and no date appears in our documents, so I worked backwards: $1.25 per million is the only rate that reproduces $0.68 from the record's own inputs. Treat it as my reconstruction, not a quoted price, and check current AWS pricing before reusing the number.
What changed after the estimate
Three things moved, in opposite directions.
| The plan, 2026-08-11 | The merged code, 2026-09-05 | |
|---|---|---|
| Variants configured | 3 | 1 (alltopics) |
| Periods per submission | 3 | 3 (all-time, day, week) |
| Boards written | 9 | 3 |
| Score rows | 9 | 3 |
| Index mirrors | 9 | 3 |
| Histogram rows | 0 | 3 |
| Idempotency rows | 0 | 2 |
| Item writes per submission | 18 | 11 |
The variant axis never grew: only one exists, because the game has not shipped topics or difficulty levels yet. A fourth period, the calendar month, arrived later but stays opt-in.
Meanwhile each board got more expensive. A per-board counter row now holds a score distribution, so an accepted score commits the score row and the counter delta together in one transaction, after a strongly consistent read to learn what it is changing. The figure counts item writes only, not that read, and not the transaction's third item, a condition check against an admin lease that stores nothing.
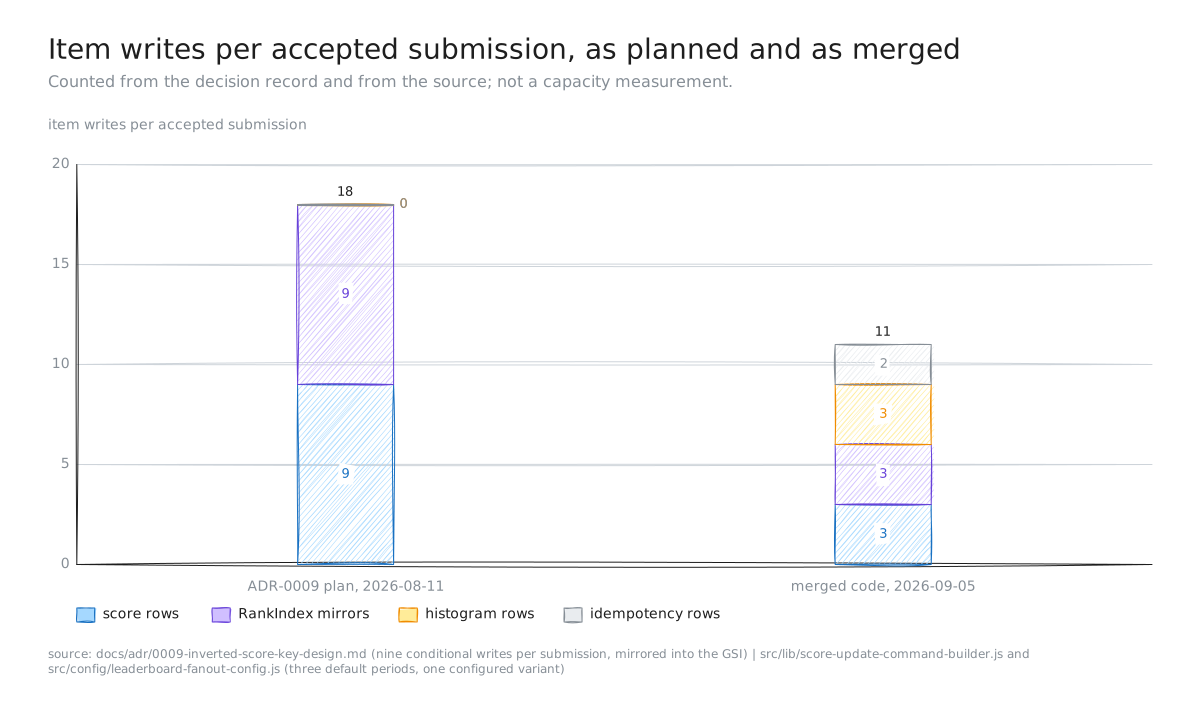
Figure 2. Item writes per accepted new-or-improving submission, counted from the decision record on the left and from the merged source on the right. Neither bar is a measured capacity figure.
The one number anyone has actually measured
On 2026-08-19 at 01:35:30Z we drove 1,000 new-player submissions at a single all-time board on DEV, at four levels of concurrency. At eight in flight all 1,000 succeeded, and the table consumed 6,868 write capacity units in the peak minute, with zero throttled requests reported.
If that minute's consumption is all this run (which the artifact does not prove, since nothing recorded the table as otherwise idle) that is roughly 6.9 units per single-board submission. The plan's model predicts two: one score row, one index mirror. The gap is the machinery added afterwards, and it is why I would not quote $0.68 today without re-deriving it.
The same run says something sharper about concurrency. A hot partition is the supermarket with one till open: DynamoDB spreads work by key, so when every write lands on one key, that key's throughput is the ceiling however idle the rest of the table is. All 128 of a board's distribution counters live on a single item, so every accepted score there touches the same key.
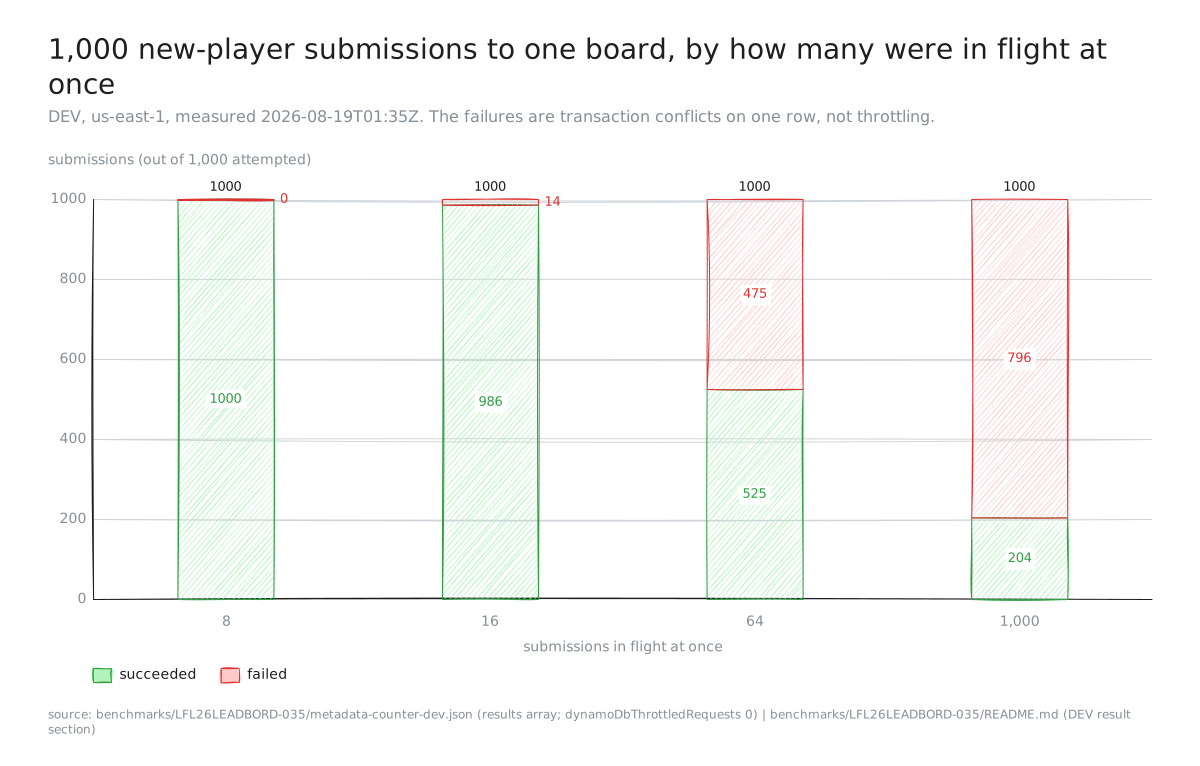
Figure 3. Outcome of 1,000 new-player submissions to one all-time board at four concurrency levels, DEV us-east-1, 2026-08-19T01:35:30Z, deployed commit e3fb772. The artifact records zero throttled requests for the 1,000-way and 8-way runs; its written decision states the 16-way and 64-way failures also happened without throttles.
At 64 in flight, 475 of 1,000 submissions failed and, by that run's own decision note, DynamoDB throttled nothing. That combination is the tell: the limit was transaction conflict on that one row, not capacity. The accepted rule from that run is to review sharding before more than eight simultaneous new or improving writes land on one board, or when the counter row reaches a quarter of the table's write consumption.
Where the evidence stops
Nobody has measured the default three-board fan-out with per-request consumed capacity. The DEV run above deliberately wrote to one board so the counter row was the only variable, and the follow-up measurement, specified in some detail, was never run: no commits, no report directory, nothing.
So, honestly: the fan-out count comes from reading code, the monthly price comes from an estimate whose unit price I had to reverse-engineer, and the only capacity measurement covers a third of the boards a real submission writes. Our written trigger for revisiting the fan-out is "write cost exceeds about $10 a month" against a $15 ceiling, and I can say where we sit against that from a model, not from a bill.
Key takeaways
- One score submission is not one write. With the default board selection it is 11 item writes plus 3 strongly consistent reads.
- Every secondary index is another write, charged separately, on every change to the base row, for as long as the index exists.
- Write down the arithmetic, not just the answer. Our record kept $0.68 and lost the unit price, so it cannot be updated without being re-derived.
- An estimate ages against the code. The variant axis shrank from three to one while the per-board cost grew, and the headline number never moved.
- Failures with no throttling recorded mean contention, not capacity. At 64 in flight we lost 475 of 1,000 submissions that way.
What we would do next
- Measure a real default submission end to end:
ReturnConsumedCapacityon every command in the path, logged, totalled for one three-board submission. - Put a dated price and a link in the cost estimate, so the next person updates it instead of re-deriving it.
- Repeat the concurrency sweep against the three-board fan-out: three counter rows per submission is three chances to conflict, not one.
- Re-check the estimate against a real bill before the fan-out widens, because the variant axis is one configuration change away from tripling.
Evidence
All times UTC.
- Nine writes per submission, mirrored into the index, "~$0.68/month at 1,000 submissions/day":
docs/adr/0009-inverted-score-key-design.md, Consequences. The record states the result only; steps 1 to 4 above are my reconstruction, and the $1.25-per-million unit price appears nowhere in the repository. - On-demand billing and a single index:
docs/adr/0010-table-and-index-design.md:BillingMode: PAY_PER_REQUEST,RankIndexprojectionINCLUDE (displayName, country, lastPlayedAt). - Three periods, one variant, in the merged code:
src/lib/score-update-command-builder.js(DEFAULT_BOARD_PERIOD_KINDS=alltime,daily,weekly;BOARD_PERIOD_KINDSaddsmonthlyas opt-in) andsrc/config/leaderboard-fanout-config.js(DEFAULT_LEADERBOARD_VARIANTS=['alltopics'], widened only by deployment configuration). - The 11 item writes:
src/handlers/submit-score-handler.js: one reservationPutCommand, oneGetCommandper board withConsistentRead: true, oneTransactWriteCommandper board, one outcomeUpdateCommand. The transaction's three items come frombuildAtomicScoreMetadataWriteinsrc/lib/leaderboard-metadata-counter.js: a leaseConditionCheckstoring nothing, the score update, and the counter delta. - 6,868 write capacity units in the peak minute, 1,000 of 1,000 succeeded at concurrency 8, 0 throttled requests:
benchmarks/LFL26LEADBORD-035/metadata-counter-dev.json, measured2026-08-19T01:35:30.415Z, deployed commite3fb772, operation "new-playerPOST /scoreswithboards=[alltime]". - 204 / 525 / 986 / 1,000 successes at 1,000 / 64 / 16 / 8 in flight, and the sharding trigger: same file,
resultsanddecision; narrative inbenchmarks/LFL26LEADBORD-035/README.md. Reviewed asLapis-Foundry-Labs/online-leaderboard#52, whose own summary records the 1,000-way burst committing 204 of 1,000 with zero throttles. - The measurement that never ran:
docs/archive/specifications/ticket-054-logging-specification.mdspecifies per-request consumed-capacity logging for LFL26LEADBORD-054;git log --allreturns no commit mentioning it andreports/contains no directory for it. - The $10 trigger and the $15 ceiling:
docs/PRD.md, deferred-items table ("Reducing 9-writes-per-submission amplification: write cost exceeds ~$10/month") and operating constraints.